Cryptocurrency Screener
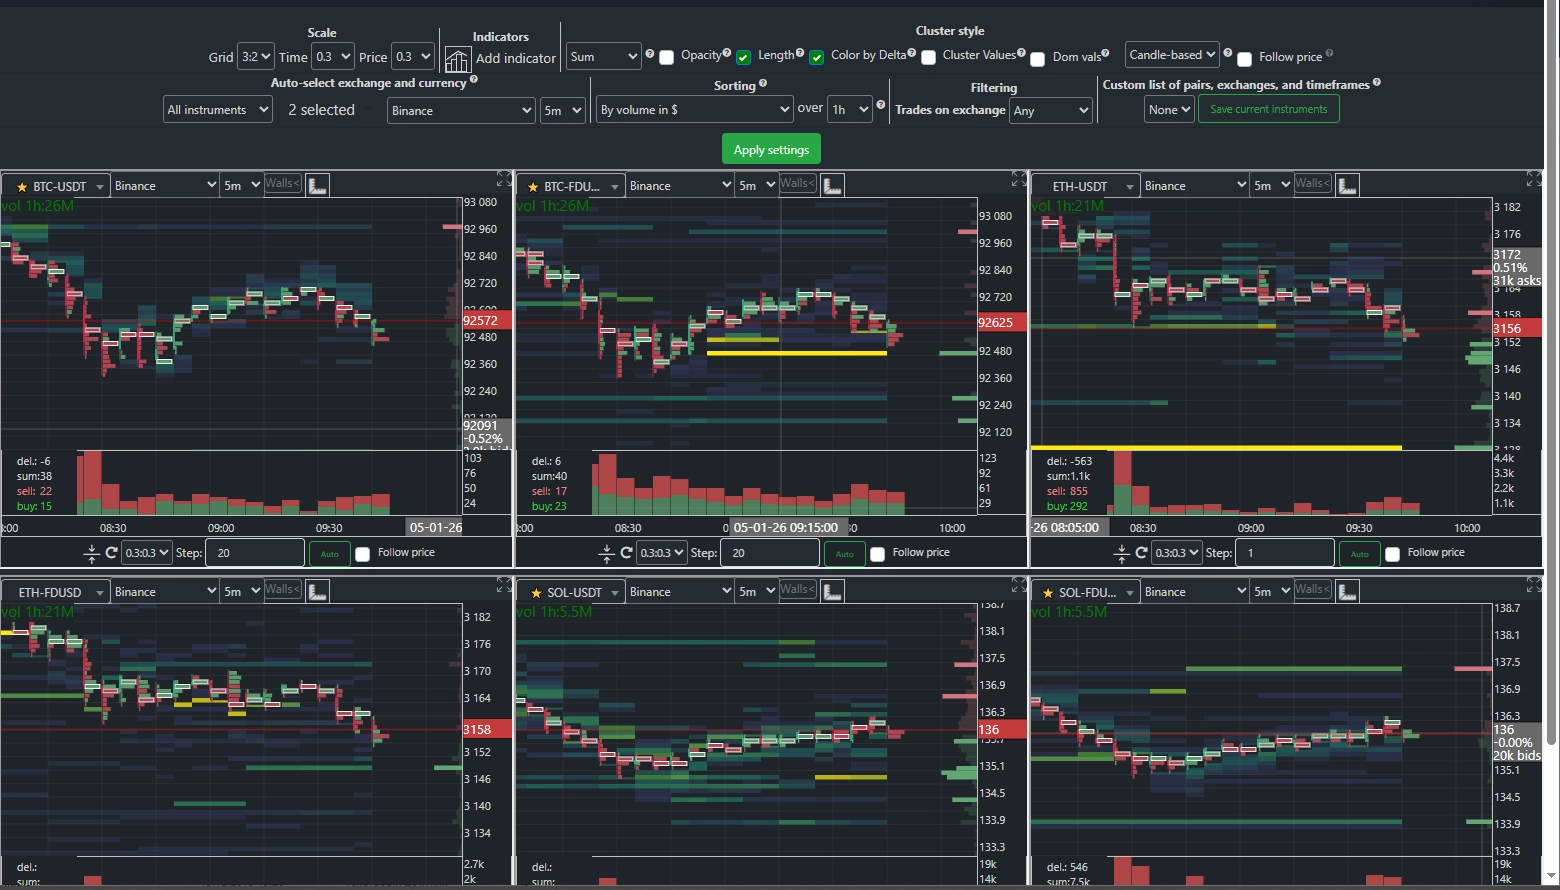
The Cluster Btc analytical system enables comprehensive analysis of multiple cryptocurrency instruments,
timeframes, and exchanges simultaneously on a single screen.
This allows you to quickly process large volumes of data and make informed decisions in real time.
For user convenience, various asset sorting methods are available to rapidly identify the most promising instruments.
You have access to a wide range of filters and indicators, along with multiple sorting modes—including filtering by trading volume,
price dynamics, and changes in the balance of buy and sell orders at various levels of market depth.
Special attention has been paid to information readability—you can display up to nine data panels on a single page,
significantly simplifying monitoring and making the analysis process even more efficient.
Grid
You can choose a grid where the first number indicates the number of instruments per row, and the second indicates the number of rows.
Adding Indicators
Indicators can be added to the charts. To do this, click the corresponding icon in the settings panel. In each indicator’s menu, you’ll find a checkbox labeled “Show panel on mini-charts in Screener mode.”
Auto-Load Options
The system offers several auto-load options for adding instruments to the screener:
All Instruments — Displays all available trading pairs on the selected exchange. If multiple stablecoins are available on the exchange, you can filter out the ones you don’t need.
All Timeframes — Shows all available timeframes for the specified pair and exchange.
All Exchanges — Displays the selected pair and timeframe across all supported exchanges, sorted by highest trading volume.
Spot Exchanges Only
Derivatives Exchanges Only
Sorting Rules
In “All Instruments” mode, you can change the sorting rule. For all other modes, instruments are sorted by total USD trading volume.
The following sorting modes are available:
By Volume Growth (%) — Sorts instruments by percentage increase in volume over the specified period.
By Price Change (%) — Displays instruments in order of the largest price movement (up or down) over the selected timeframe.
By ASK/BID Ratio Changes at Various Depths.
For each sorting mode, you can specify the time interval to be used for comparison.