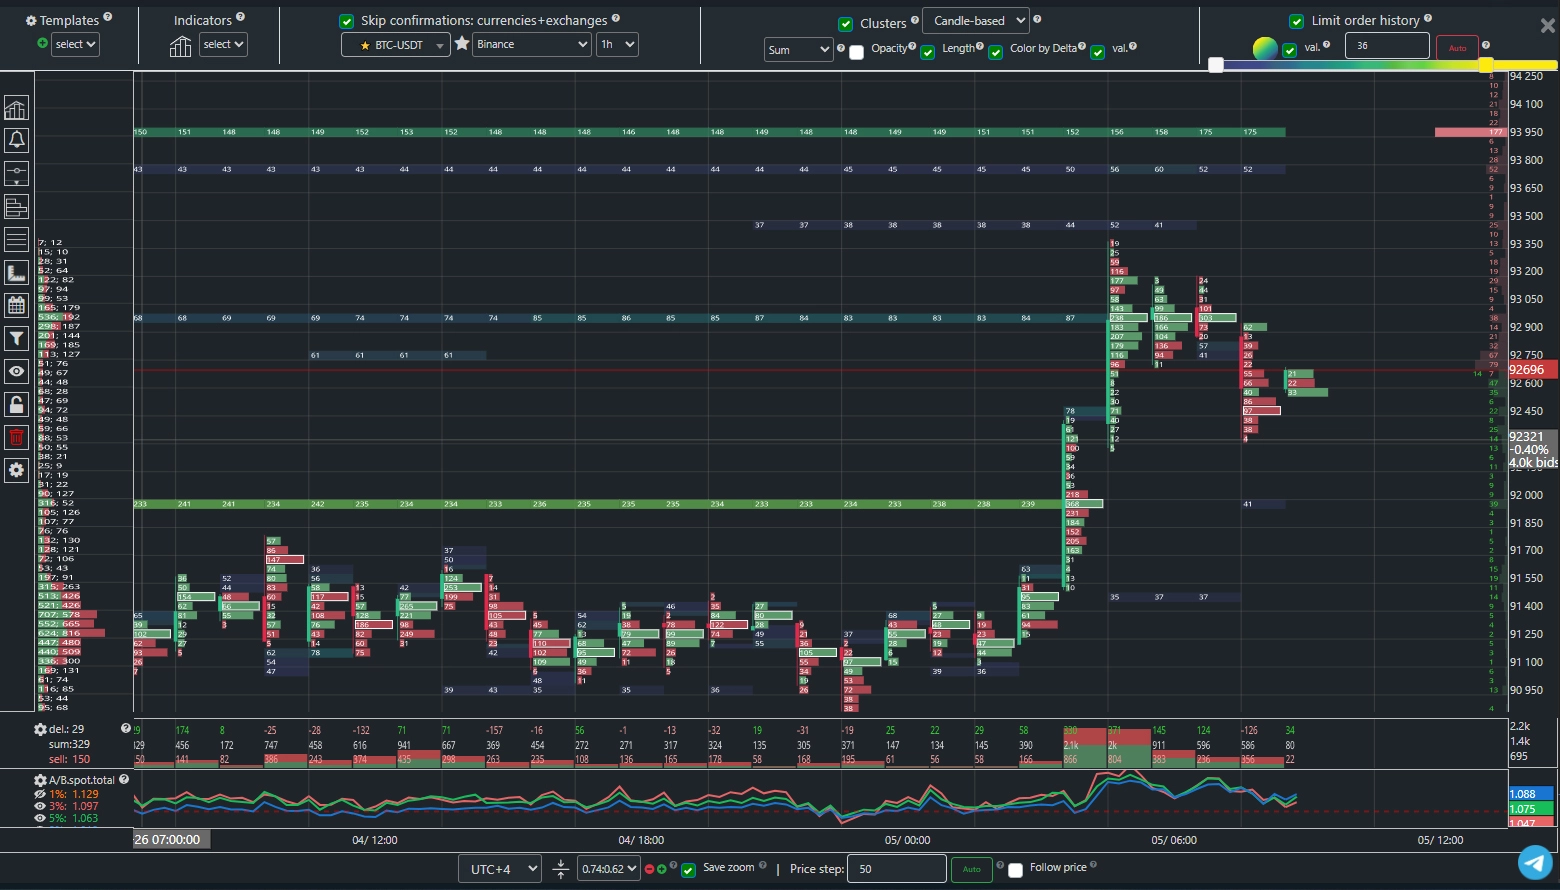
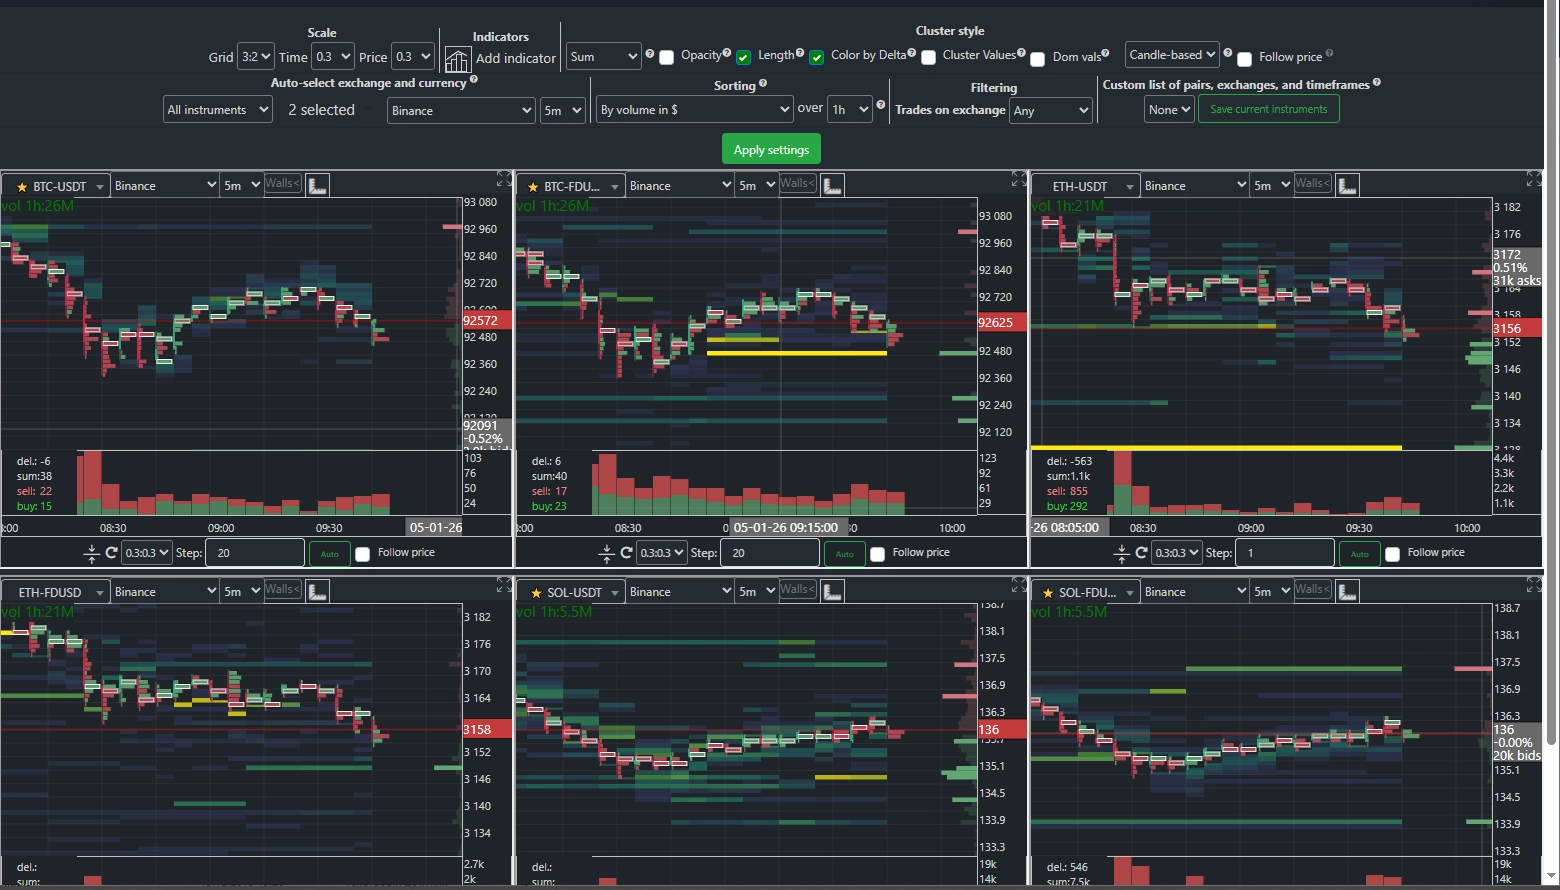
Cluster chart for Bitcoin and other cryptocurrencies with added history of large limit order movements
The cluster chart displays the volume of buys and sells executed at each price level within a specific candle. Utilizing this information helps identify zones of interest, as well as entry and exit points of major market players.
The ClusterBTC analytics system allows you to overlay the cluster chart with historical data on large limit order movements. By analyzing how major order walls shift and tracking buy/sell volumes near these walls, you can accurately identify strong support and resistance zones.
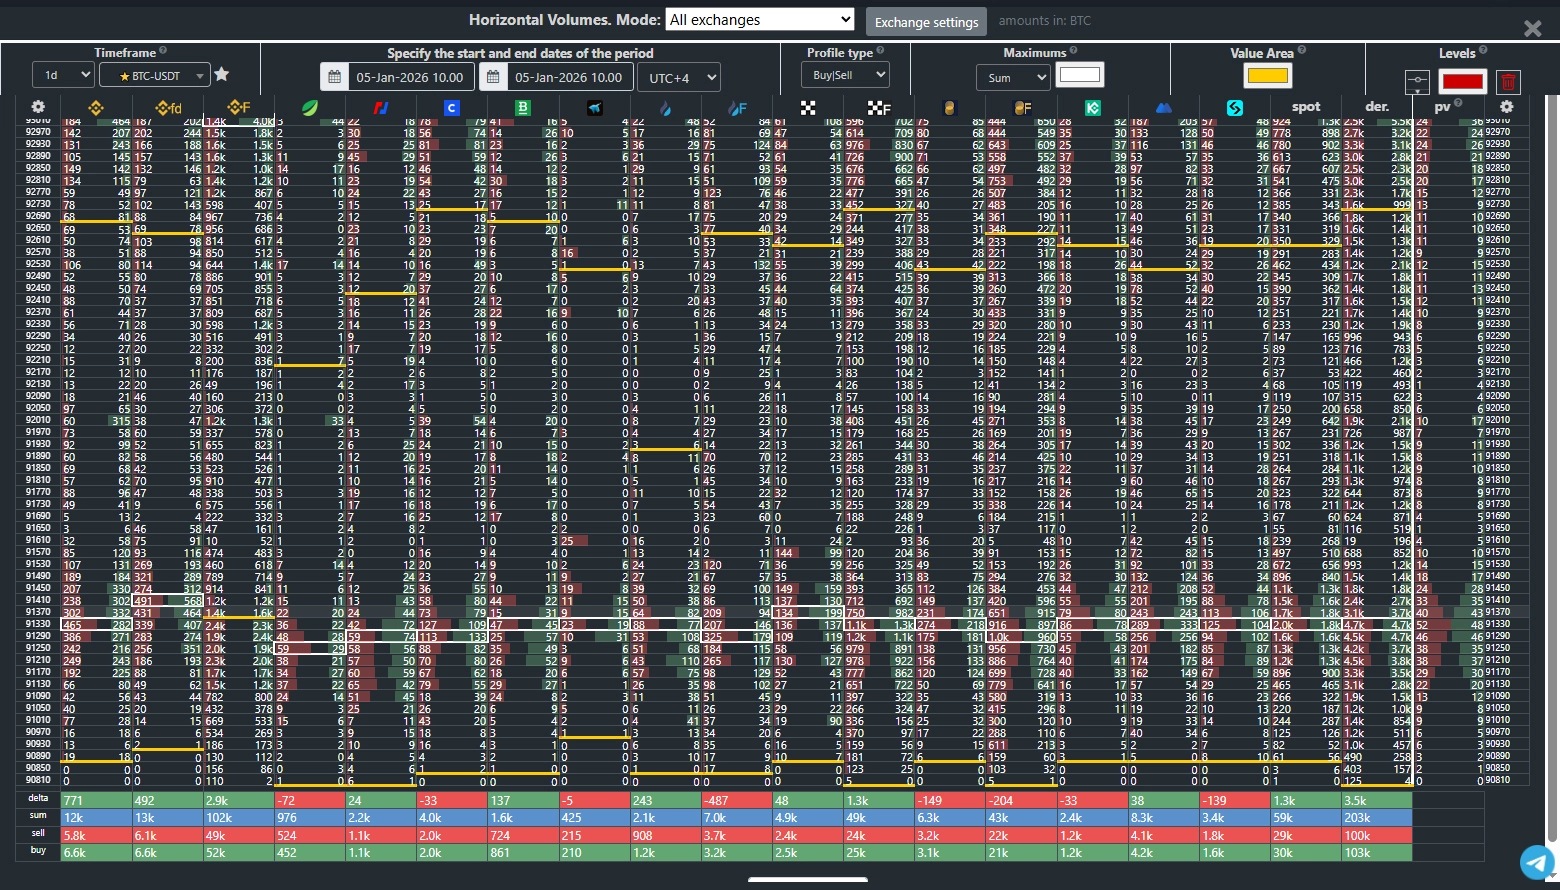
Unique cluster chart mode — "Spot Exchanges Aggregate". Combines all limit and market orders from top liquidity spot platforms into a unified cluster chart, revealing true market structure beyond single-exchange data. Binance (usdt, tusd, fdusd, busd), Coinbase, Bitfinex, Bitstamp, Htx, Okx, Bybit, Mexc, KuCoin, Bitget. Allows you to assess the overall spot market, all limit order walls, and market orders on a single chart—regardless of the exchange they were placed on.
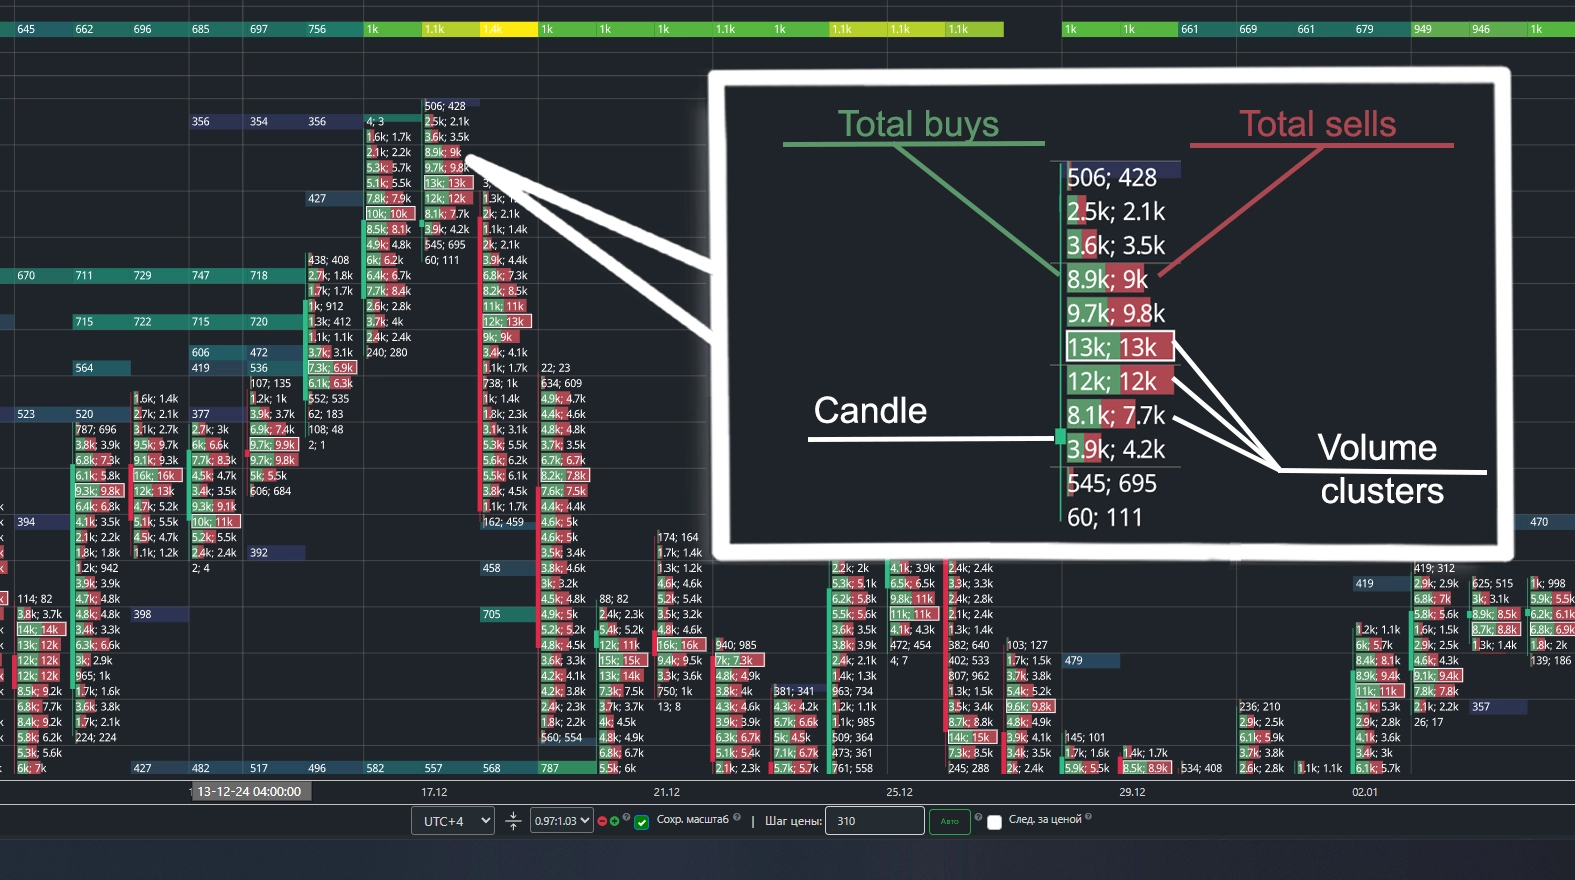
Clusters
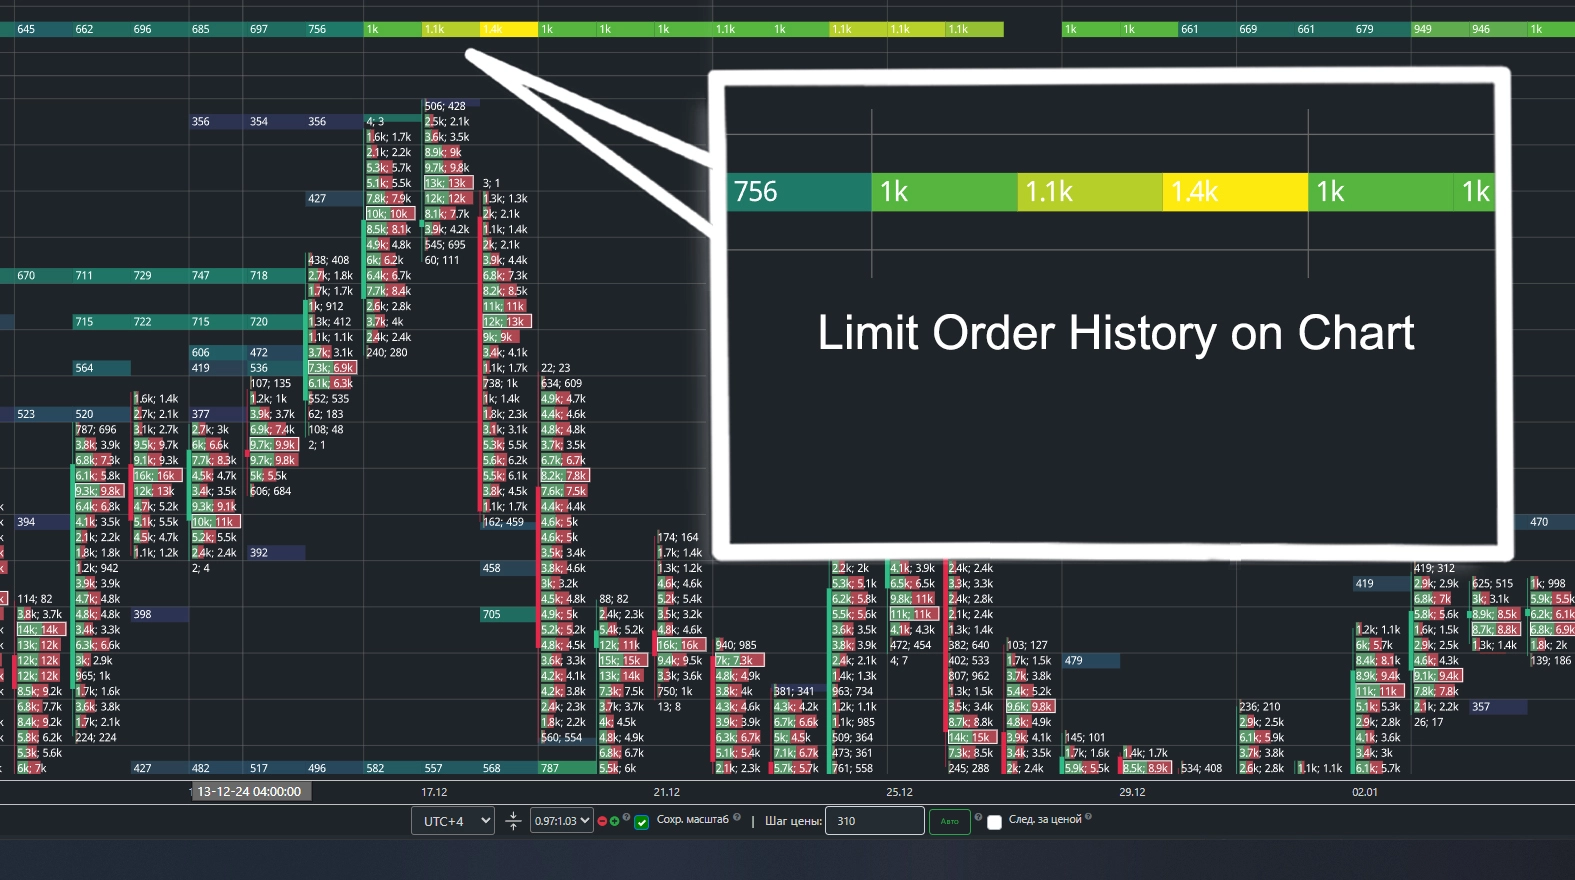
Limit order walls movement history
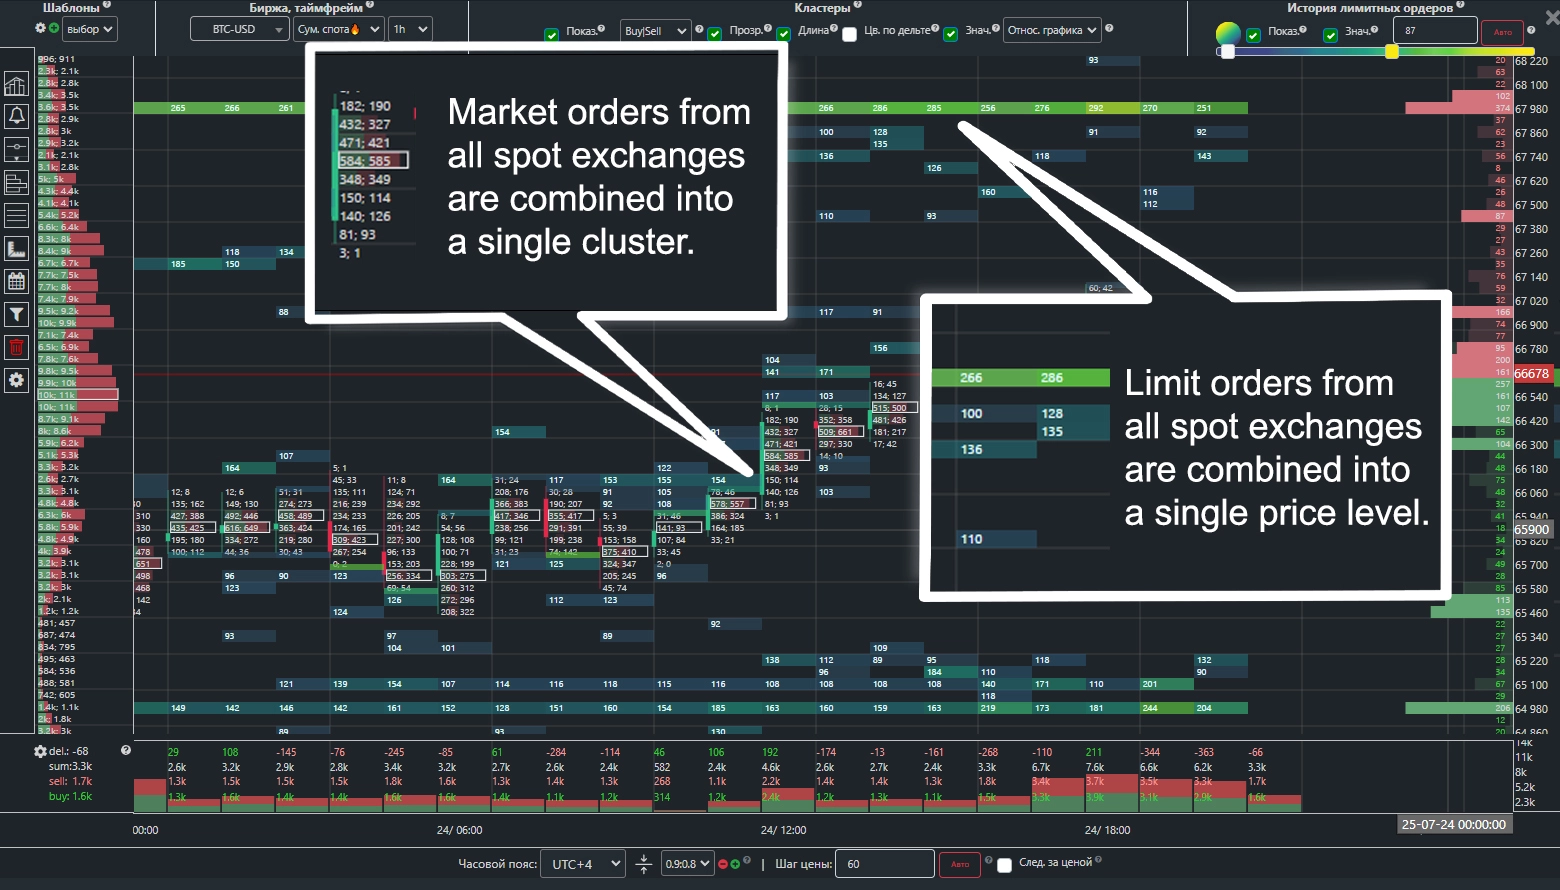
Aggregated Spot Exchanges Mode
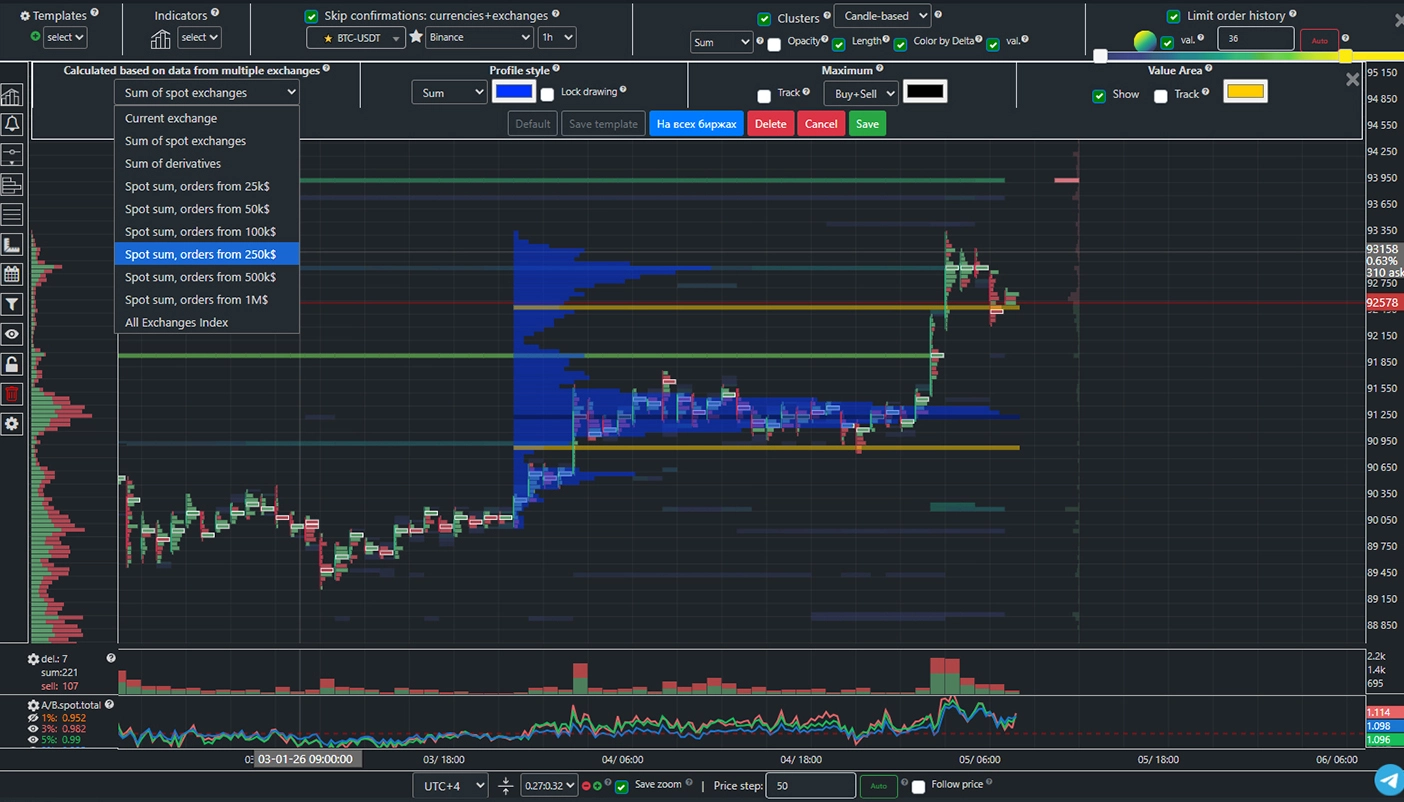
Aggregate volume profile across all exchanges.
Want to learn more?
Key features in 1.5 minutes
Explore the key points.
Complete guide in 18 minutes
Get comprehensive information.
Discover all analysis modes
Cluster chart
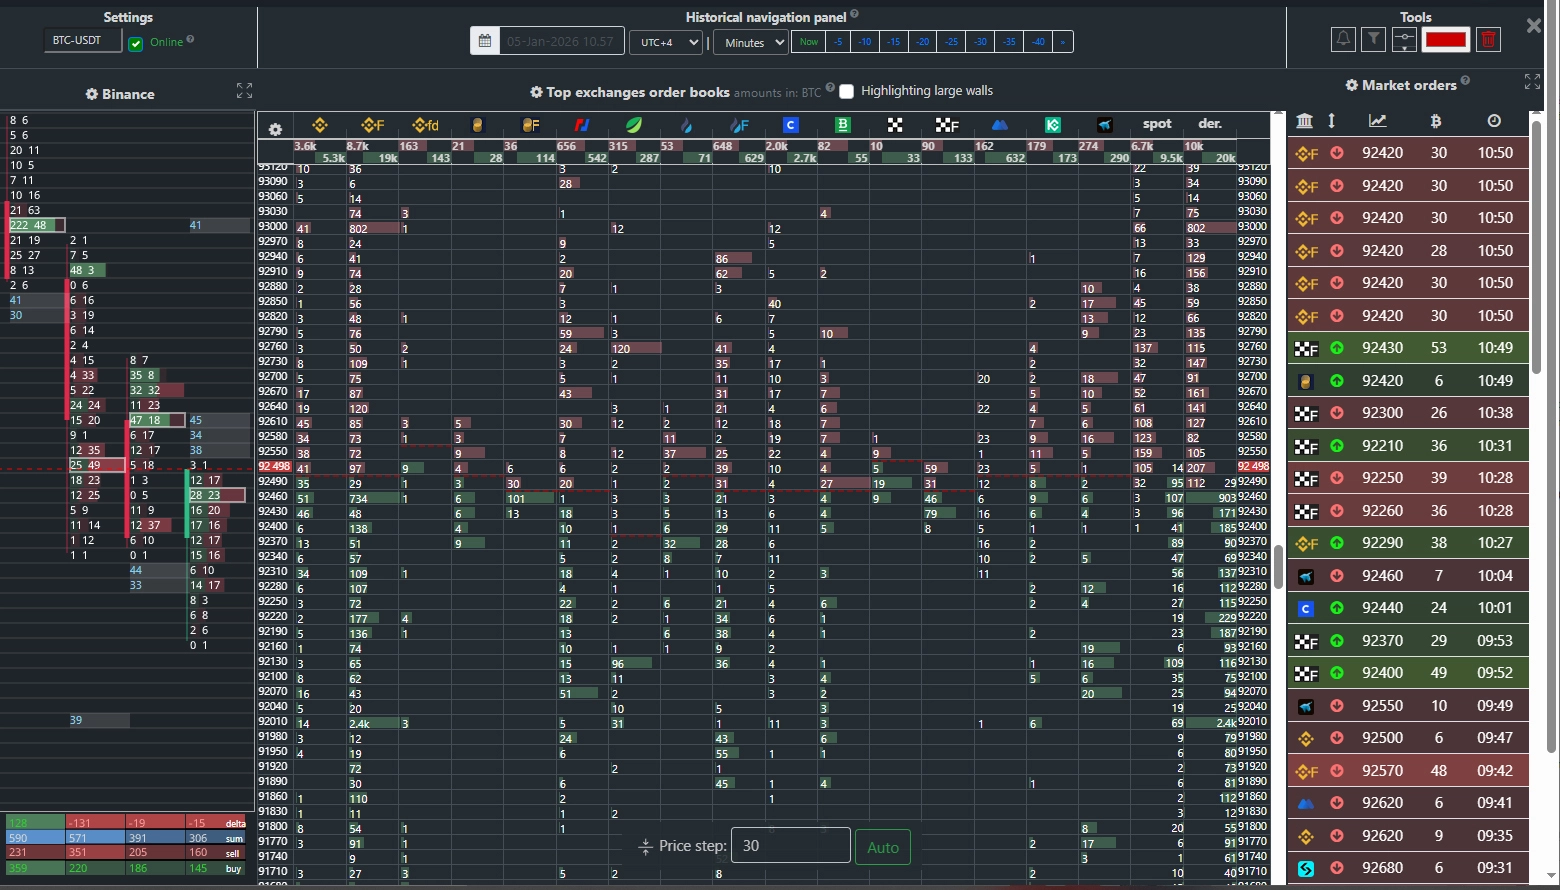
Bitcoin order books
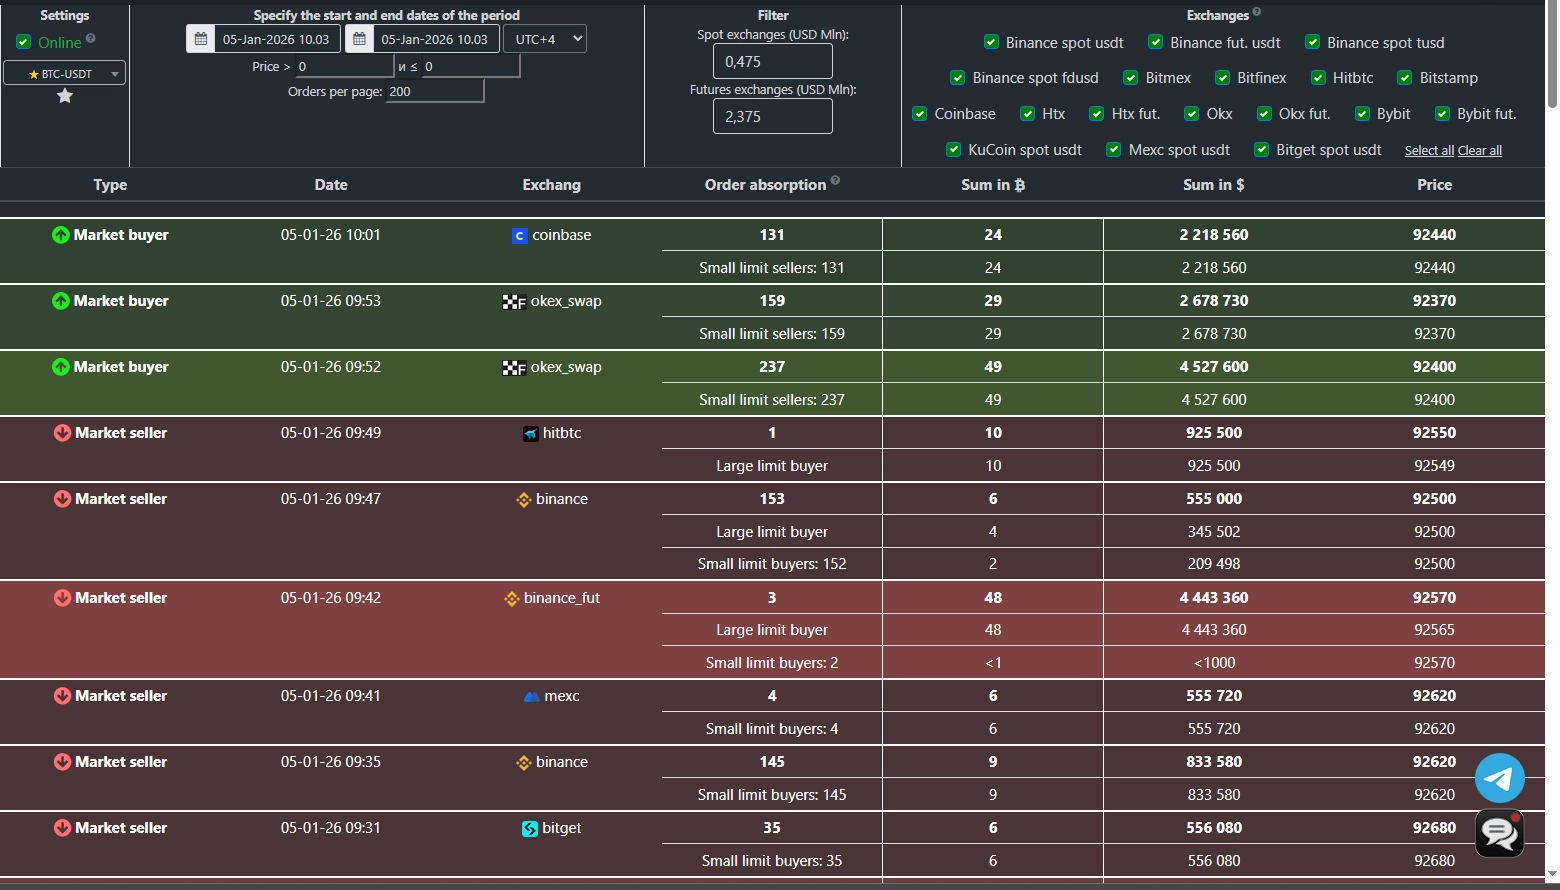
Market orders
Volum
Cryptocurrency screener
7 days
1 Month
12.78
- Basic plan
- Save 0 $
- All features available.
3 Months -17%
38.34
31.81
- Only 10.6 $ / month
- Save 6.52 $
- All features available.
1 Year -34%
153.36
101.19
- Only 8.43 $ / month
- Save 52.13 $
- All features available.