Cluster Chart
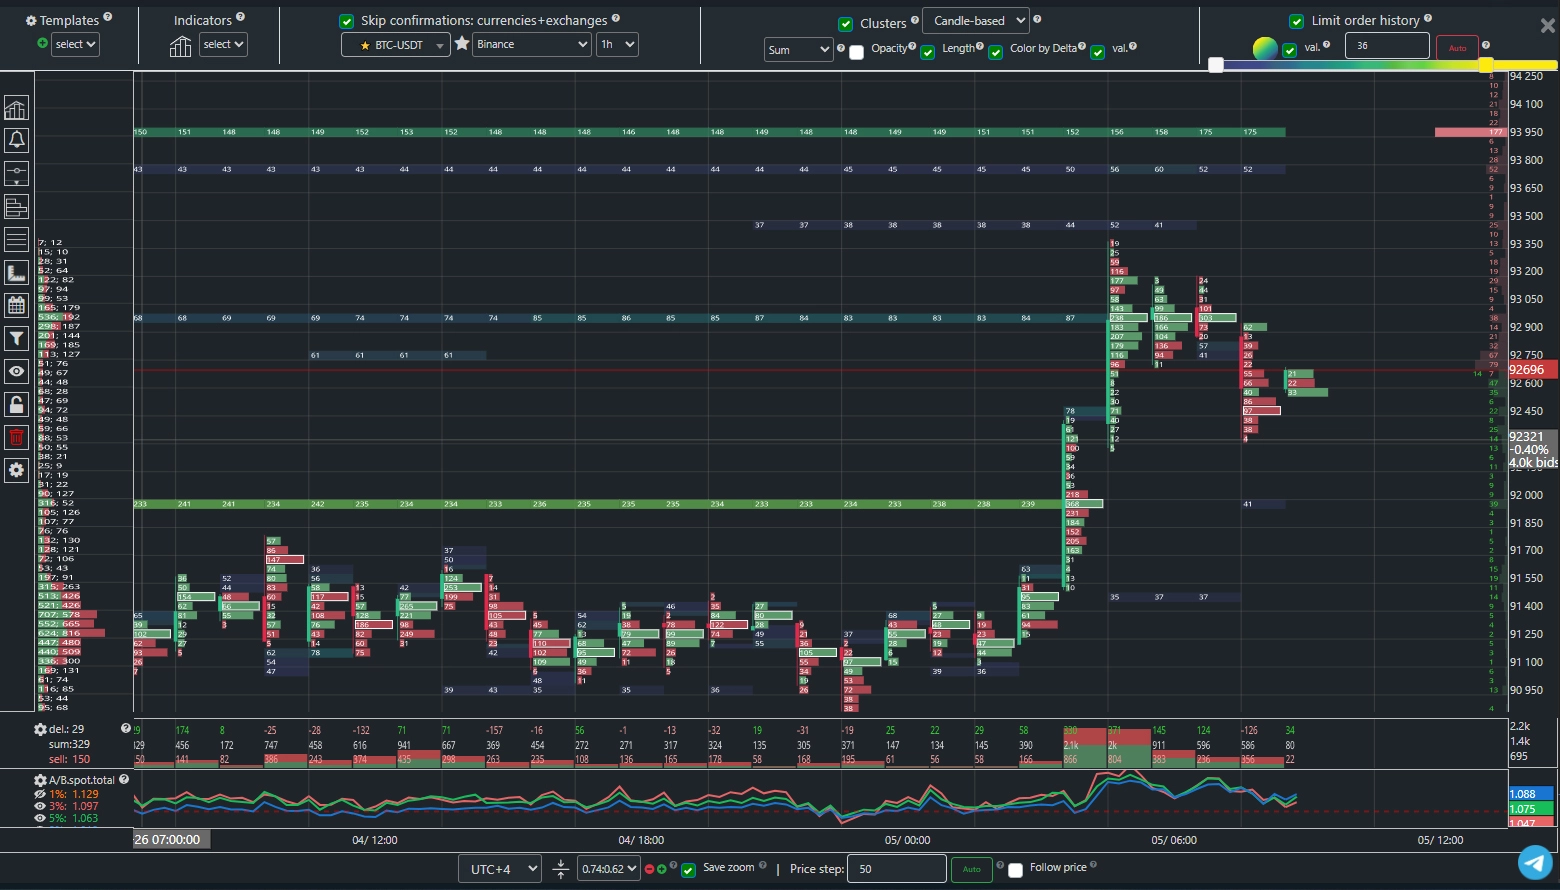
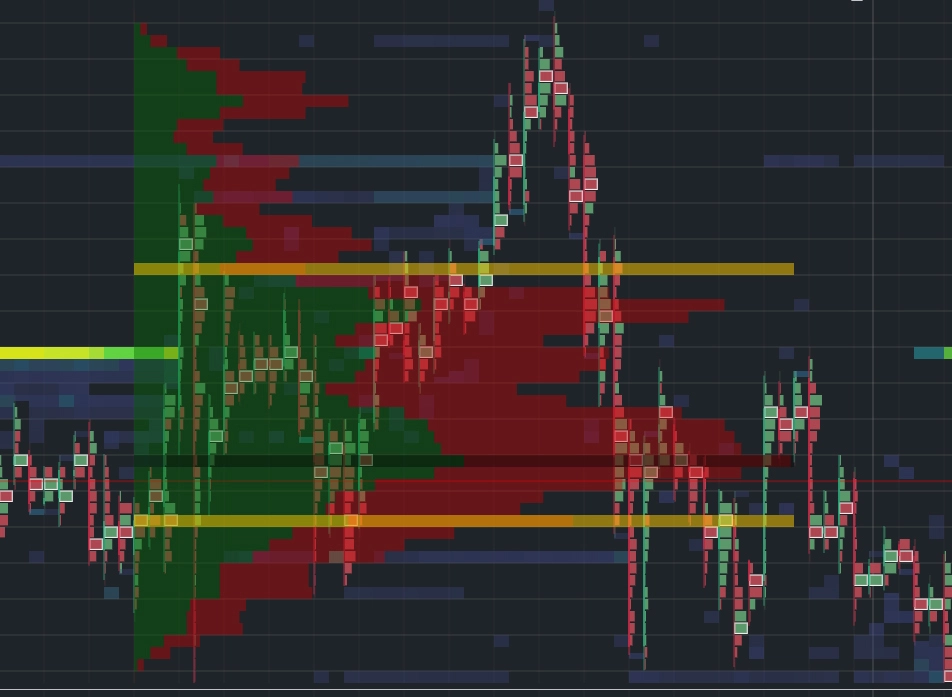
The image above shows the general view of the cluster chart with added
historical data on large limit order walls from the order book.
In addition to standard candles, the cluster chart displays market order volume at each price step,
providing excellent opportunities for detailed analysis of buyer and seller reactions at every price level.
Clusters help you understand whether buyers or sellers currently dominate the market.
Cluster Btc allows you to combine the cluster chart with the historical movement of large
limit orders.
Whales enter the market using limit orders, and tracking their movement
can significantly improve your trading performance.
Initial Setup
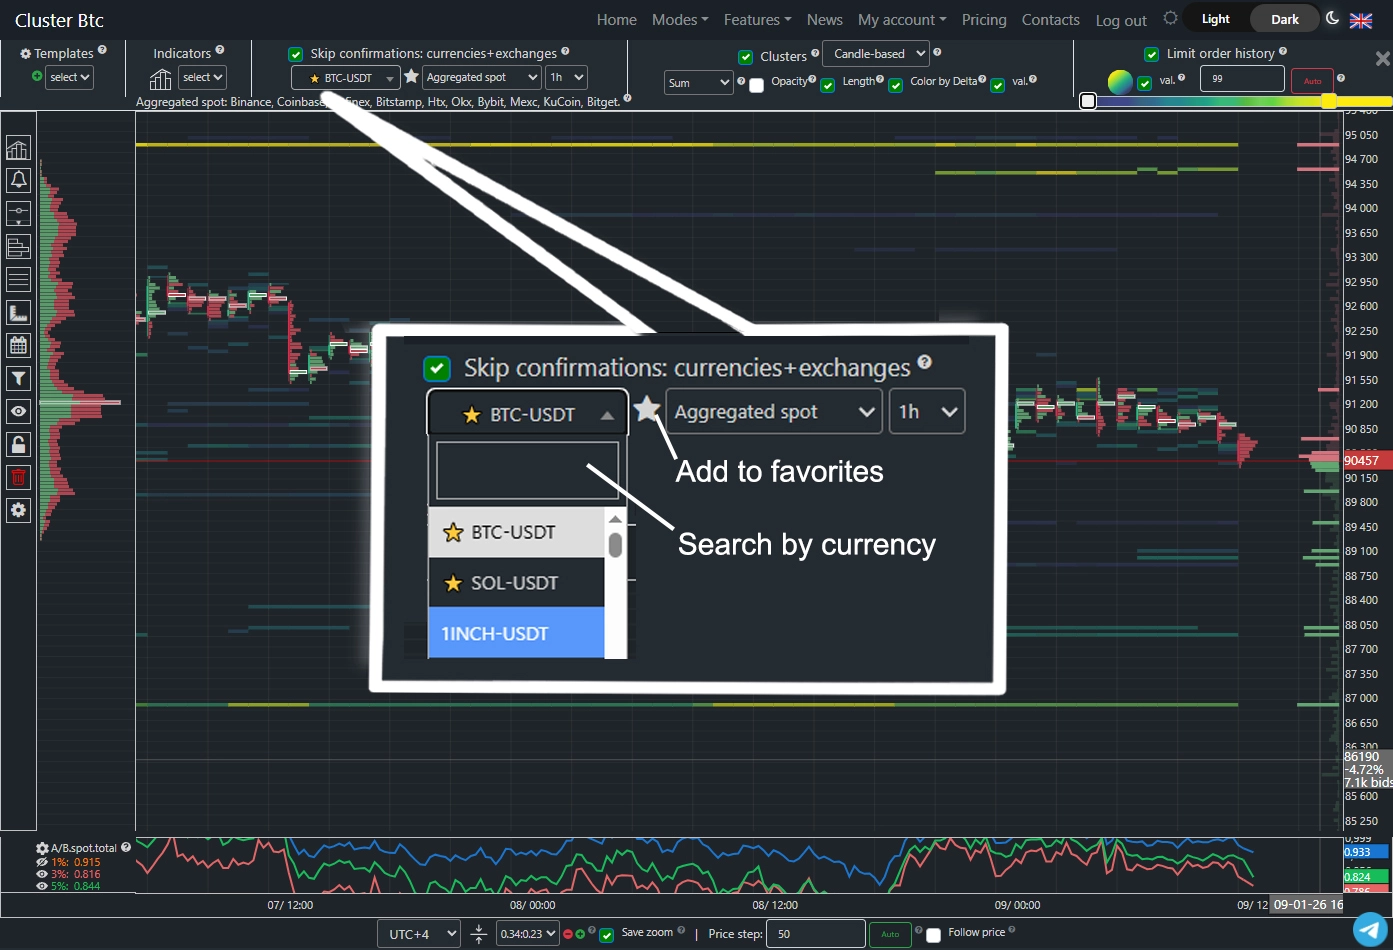
In the search field, you can type the name of the desired cryptocurrency for quick selection of the trading pair.
Click the star icon to add this pair to your favorites list.
The second field lets you choose one of the supported exchanges: Binance, Binance Futures, Bybit, Bybit Futures, Bitfinex, Coinbase, BitMEX, HTX, HTX Fut., OKX, OKX Fut., Bitstamp, HitBTC, MEXC, KuCoin, Bitget.
The third field allows you to set the desired timeframe.
Scaling Presets
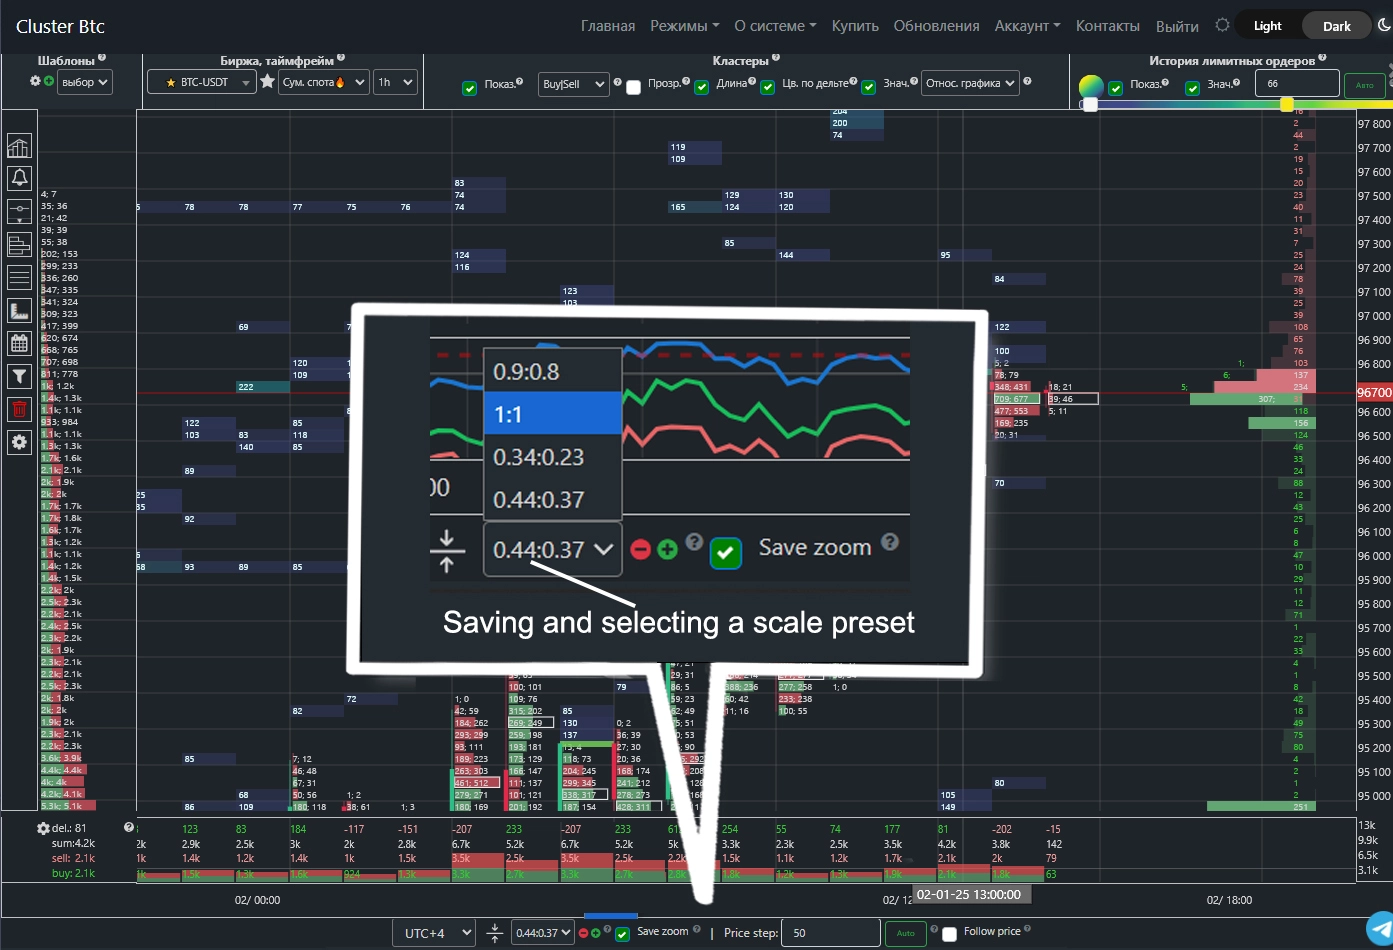 Chart scaling is performed by holding the left mouse button and dragging along the time or price axes.
After scaling the chart, you can save a preset. The preset management panel is located at the bottom of the window. To save a new scaling variant, click the green plus icon.
You can store multiple presets and switch between them.
The chart will always load using your most recently selected scale preset.
Chart scaling is performed by holding the left mouse button and dragging along the time or price axes.
After scaling the chart, you can save a preset. The preset management panel is located at the bottom of the window. To save a new scaling variant, click the green plus icon.
You can store multiple presets and switch between them.
The chart will always load using your most recently selected scale preset.
Price Step
The price step determines the price range grouped into a single cluster. When you click the "Auto" button, the price step is automatically adjusted based on current market conditions, but you can manually customize this parameter as needed.“Spot Sum” and “Derivatives Sum” Charts
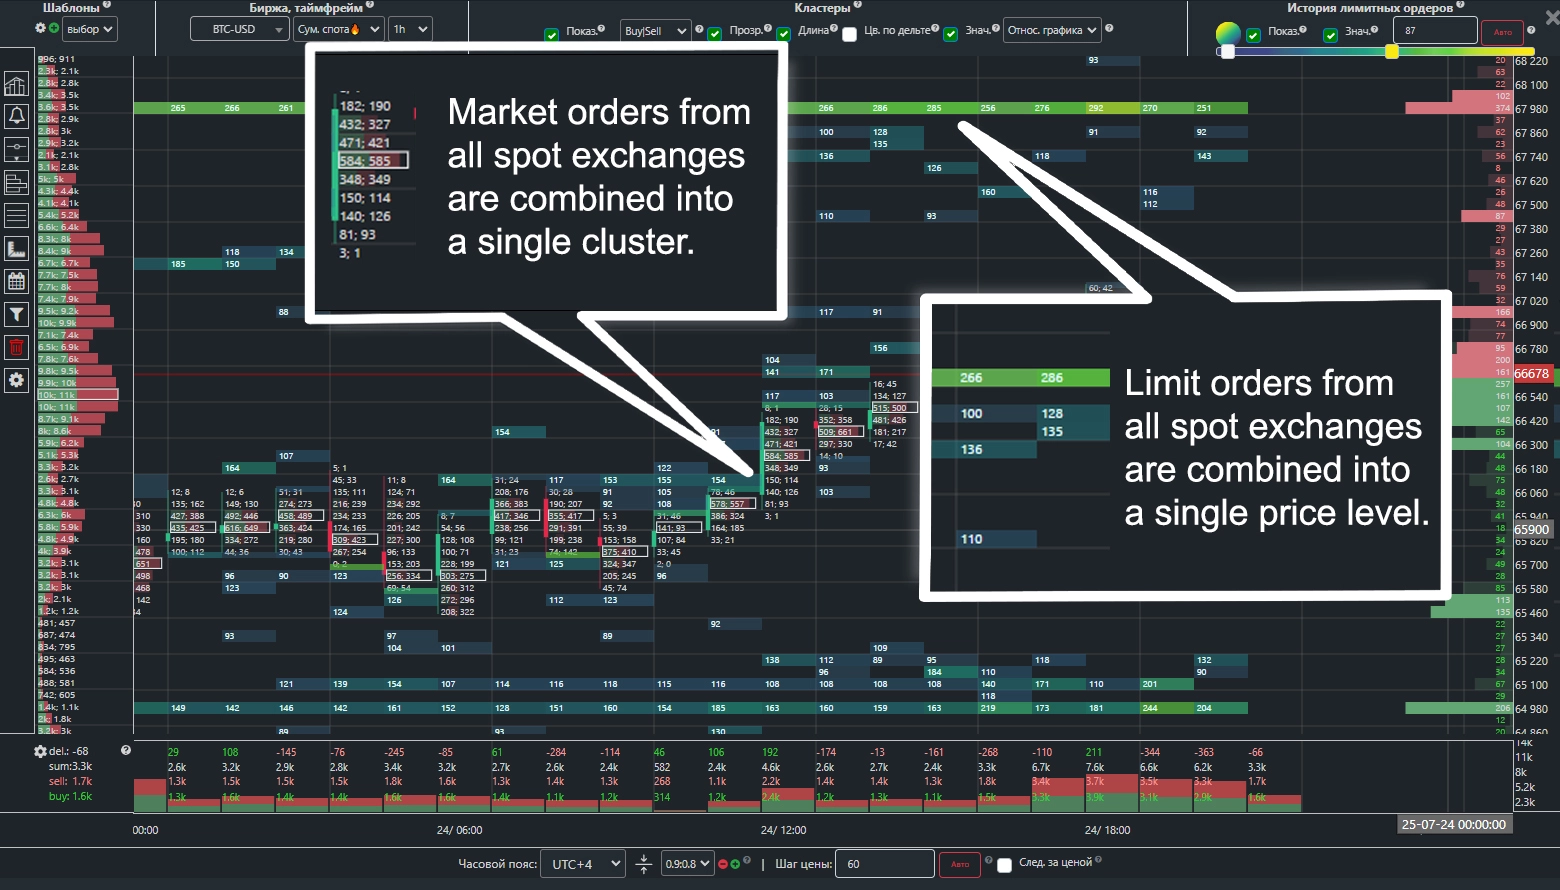
A unique cluster chart mode.
Aggregates all limit and market orders to create a unified cluster chart from the most liquid spot exchanges: Binance (USDT, USDC, FDUSD), Coinbase, Bitfinex, Bitstamp, HTX, OKX, Bybit, MEXC, KuCoin, Bitget.
This allows you to assess the entire spot market on a single chart—including all limit walls and market orders—regardless of the exchange they originated from.
You have access to multiple analytical tools, including the “Delta” and cumulative “Cumulative Delta” indicators, which show buyer/seller dominance across the entire cryptocurrency market.
“Derivatives Sum” – a chart mode similar to “Spot Sum,” but constructed using futures and other derivatives markets.
It aggregates all limit and market orders into a unified derivatives cluster chart from the following platforms: Binance Futures, BitMEX, Huobi Futures, OKX Fut., Bybit Futures.
To activate this mode, select “Spot Sum” or “Derivatives Sum” in the exchange field.
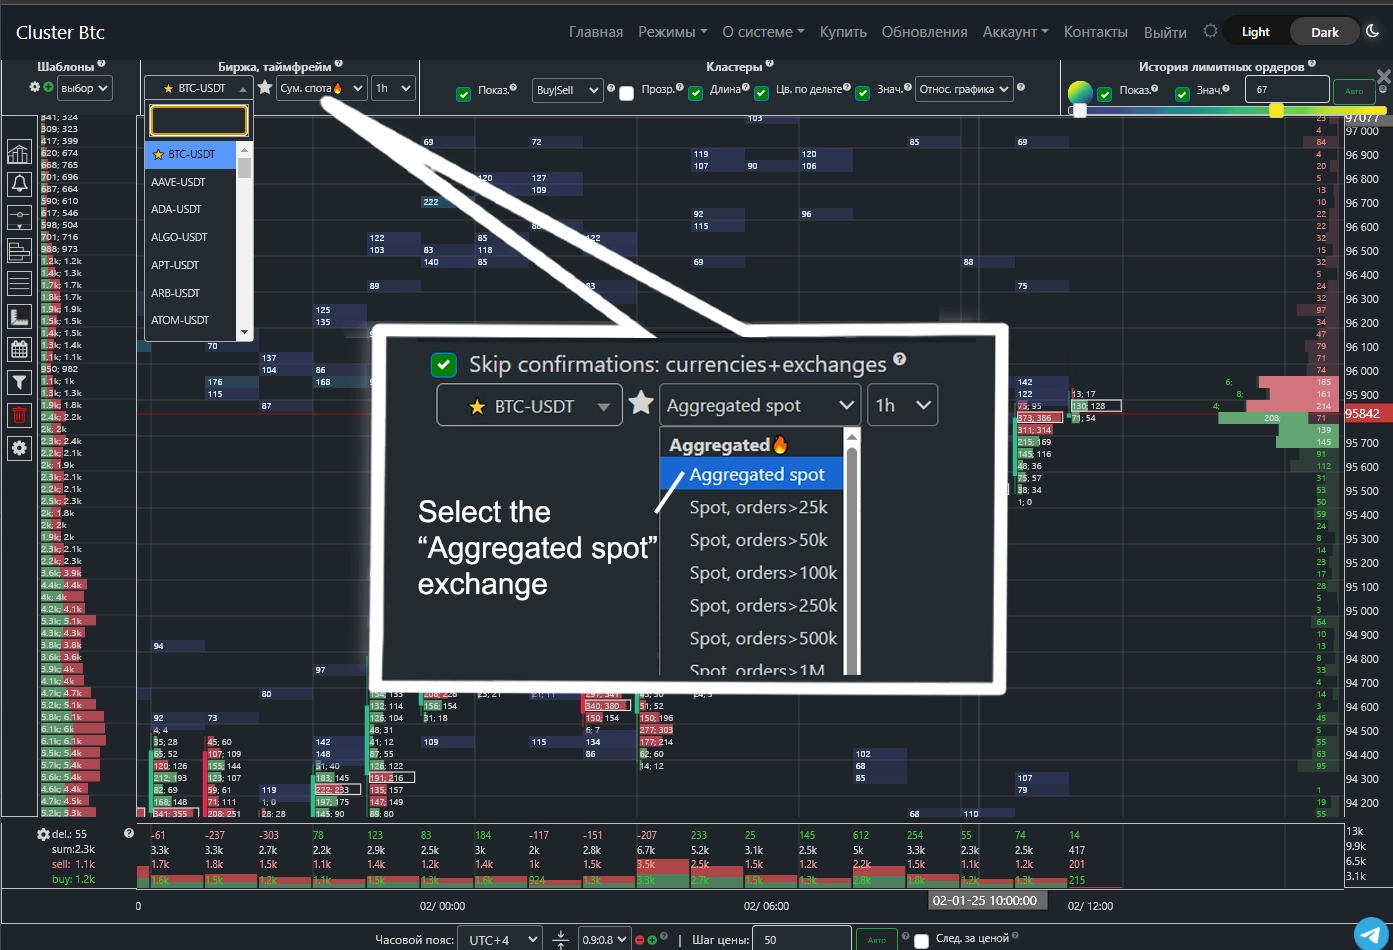
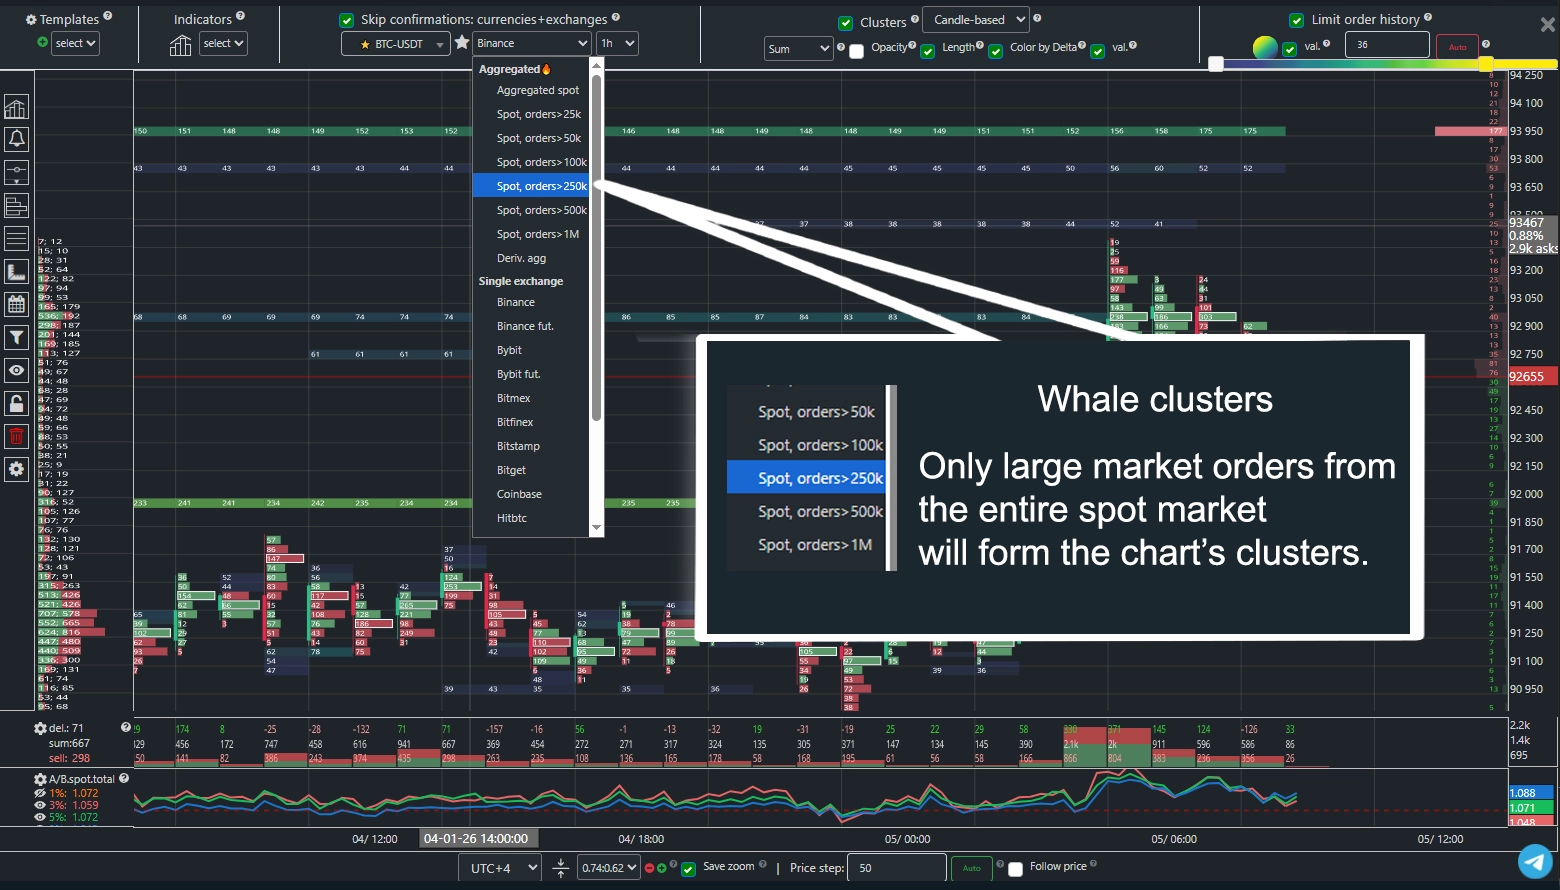
Aggregated Spot Cluster Charts for Whales
This chart is built exclusively from large market orders, filtering out all insignificant trades.
Data is aggregated from leading spot exchanges, allowing you to see the overall activity of major market participants in one place.
To launch this view, open the cluster chart mode and go to the exchange selection panel. You’ll find multiple chart options with different minimum order volume thresholds—from $25,000 to $1,000,000.
You can select the appropriate filter threshold based on the instrument’s trading volume, current market activity, and your trading strategy.
Key indicators—such as volume, delta, and cumulative delta—are calculated from this filtered data. These metrics reflect only whale activity across all spot exchanges, making them especially valuable for analysis.
Cluster Configuration
Cluster Btc offers several types of cluster charts.
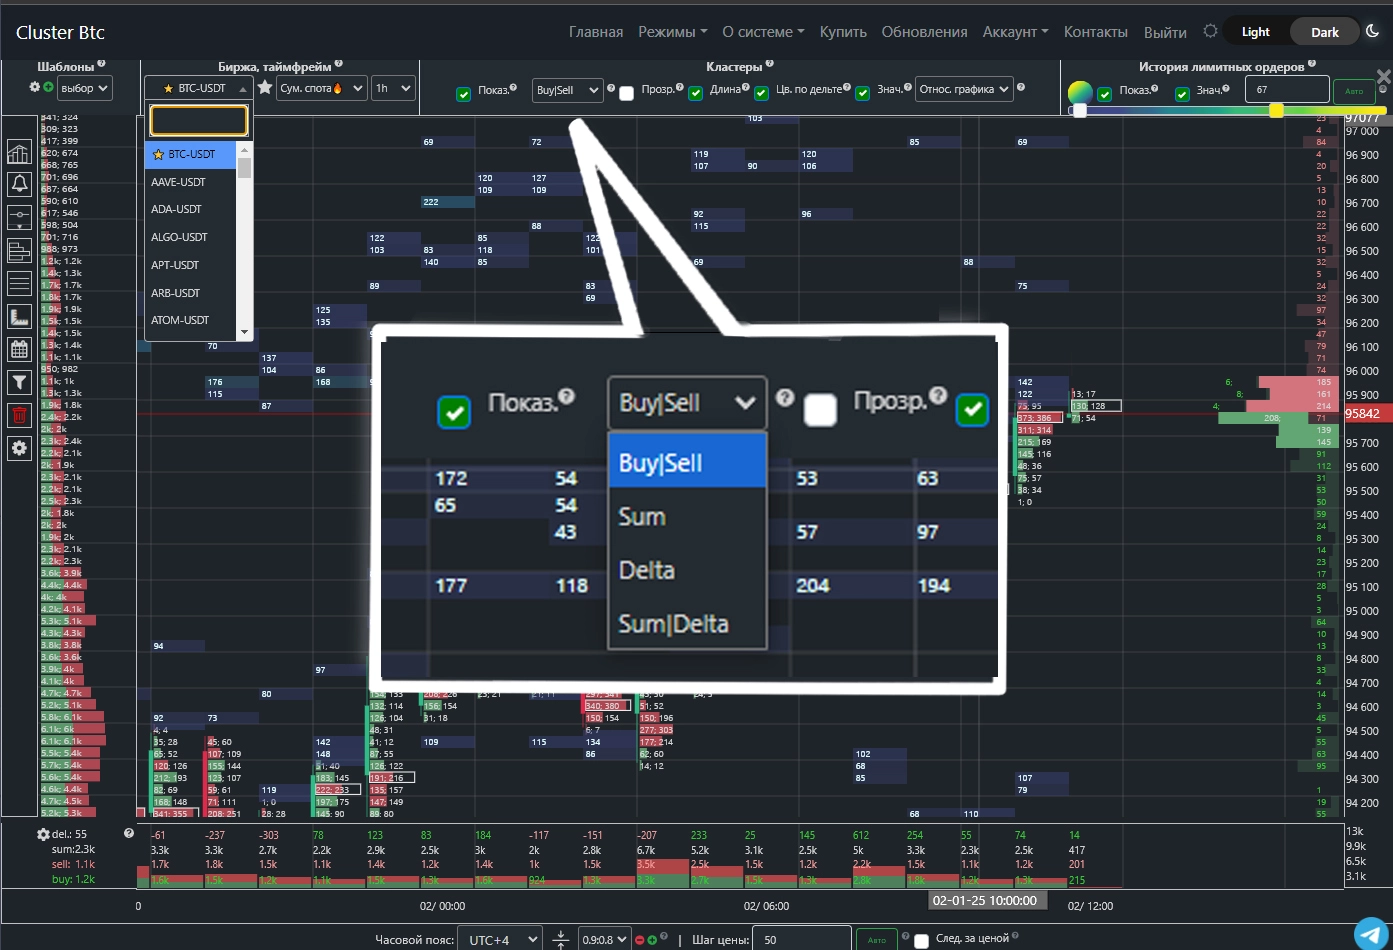
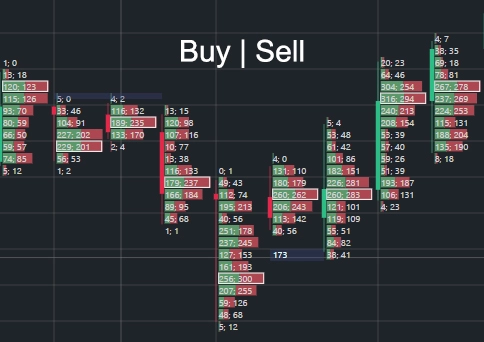
Cluster Type: Buy | Sell.
The cluster is split into two parts: the green bar shows buy volume, the red bar shows sell volume.
Numerical values follow the same order—buys first, then sells.
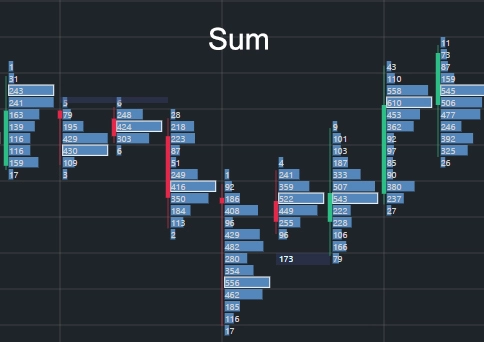
Cluster Type: Sum.
The cluster displays the total of buys and sells.
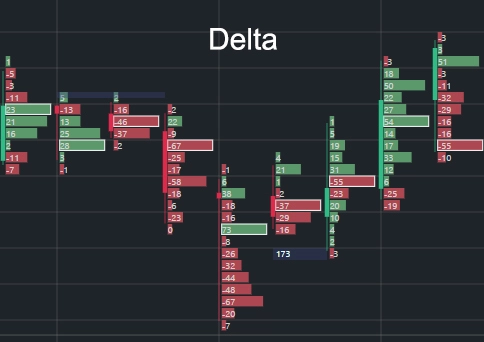
Cluster Type: Delta.
This cluster type shows the difference between buys and sells. A negative value indicates more sells; a positive value indicates more buys. The cluster color also reflects dominance—green for buys, red for sells.
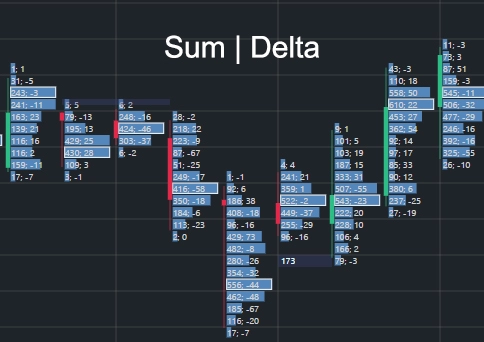
Cluster Type: Sum | Delta.
The first value shows total buy + sell volume; the second shows the delta (difference between them).
Cluster Appearance Settings
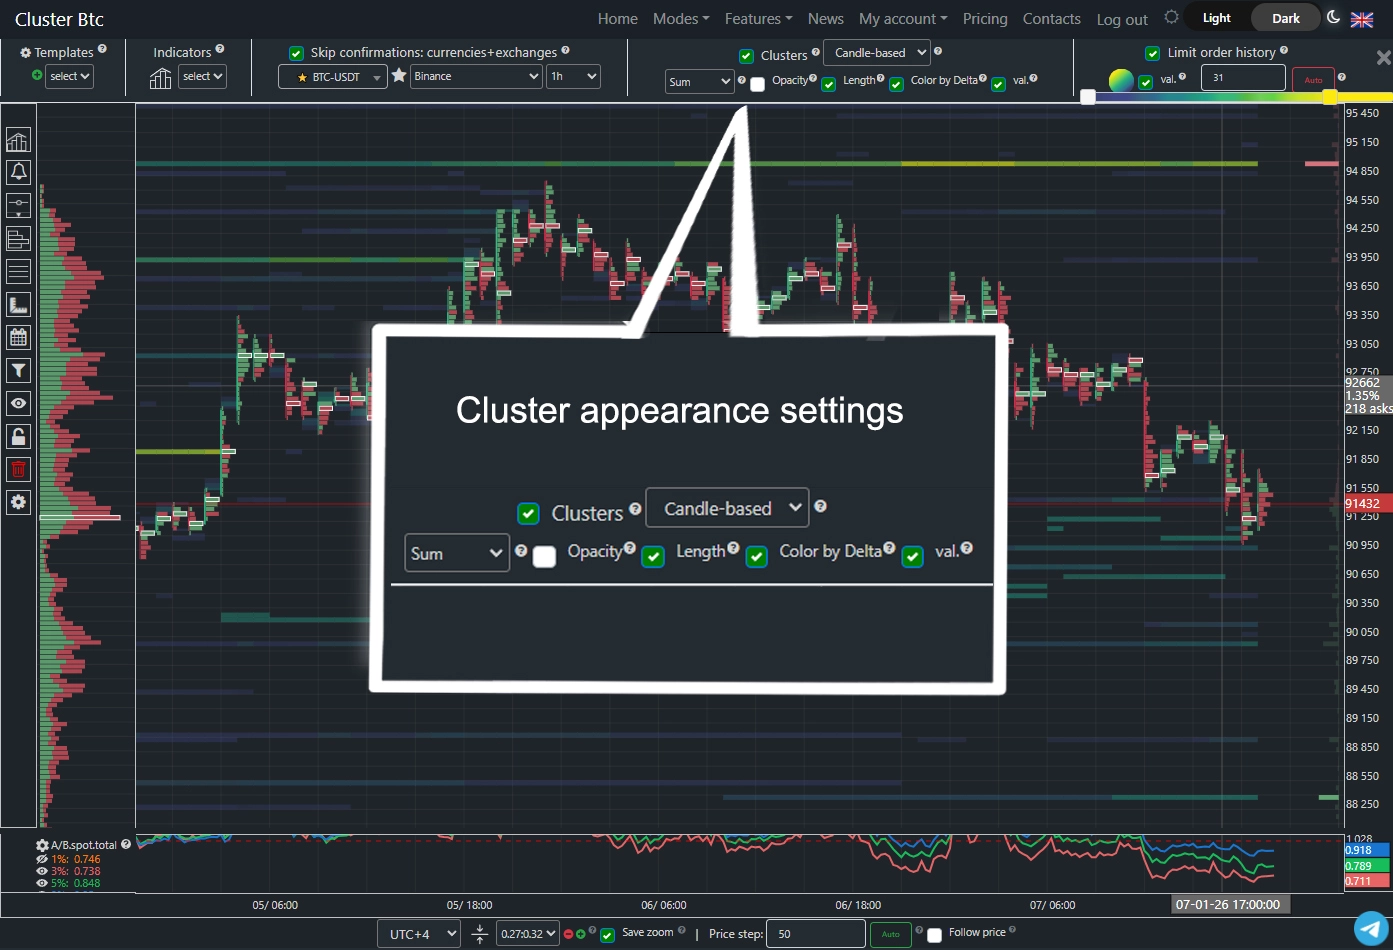 Using the following settings, you can customize the visual appearance of clusters to your preference.
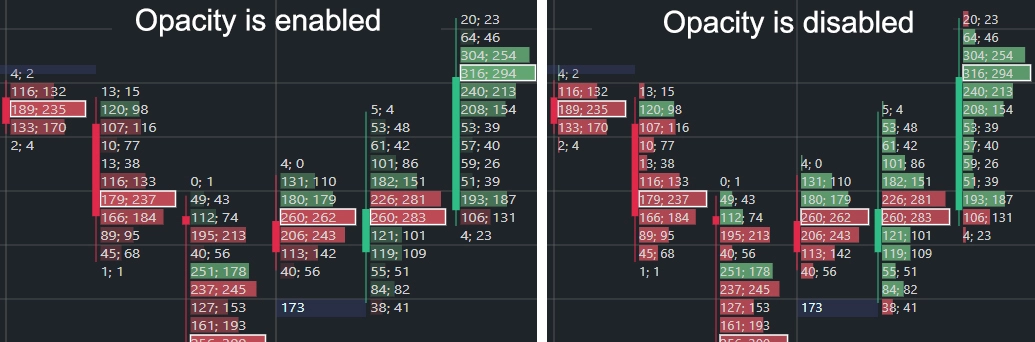
Opacity.
When enabled, cluster opacity depends on volume value.
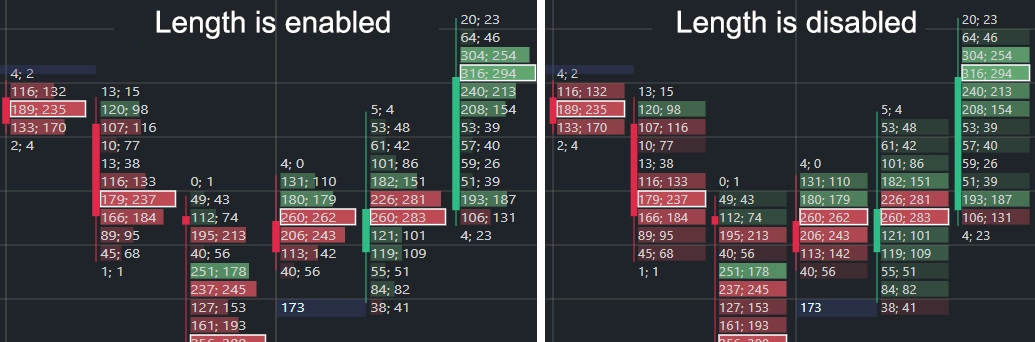
Length
If enabled, cluster length varies with volume. If disabled, all clusters have equal length.
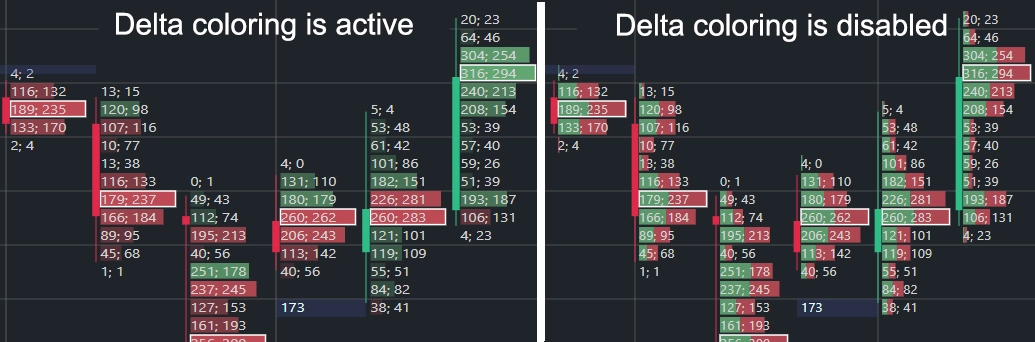
Color by Delta.
When enabled, cluster color reflects its delta:
red for negative delta (more sells), green for positive delta (more buys).
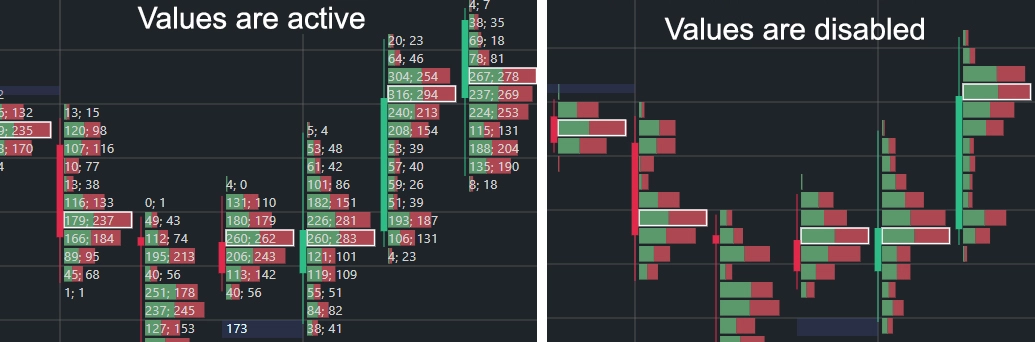
Values.
Toggle the display of numerical values inside clusters.
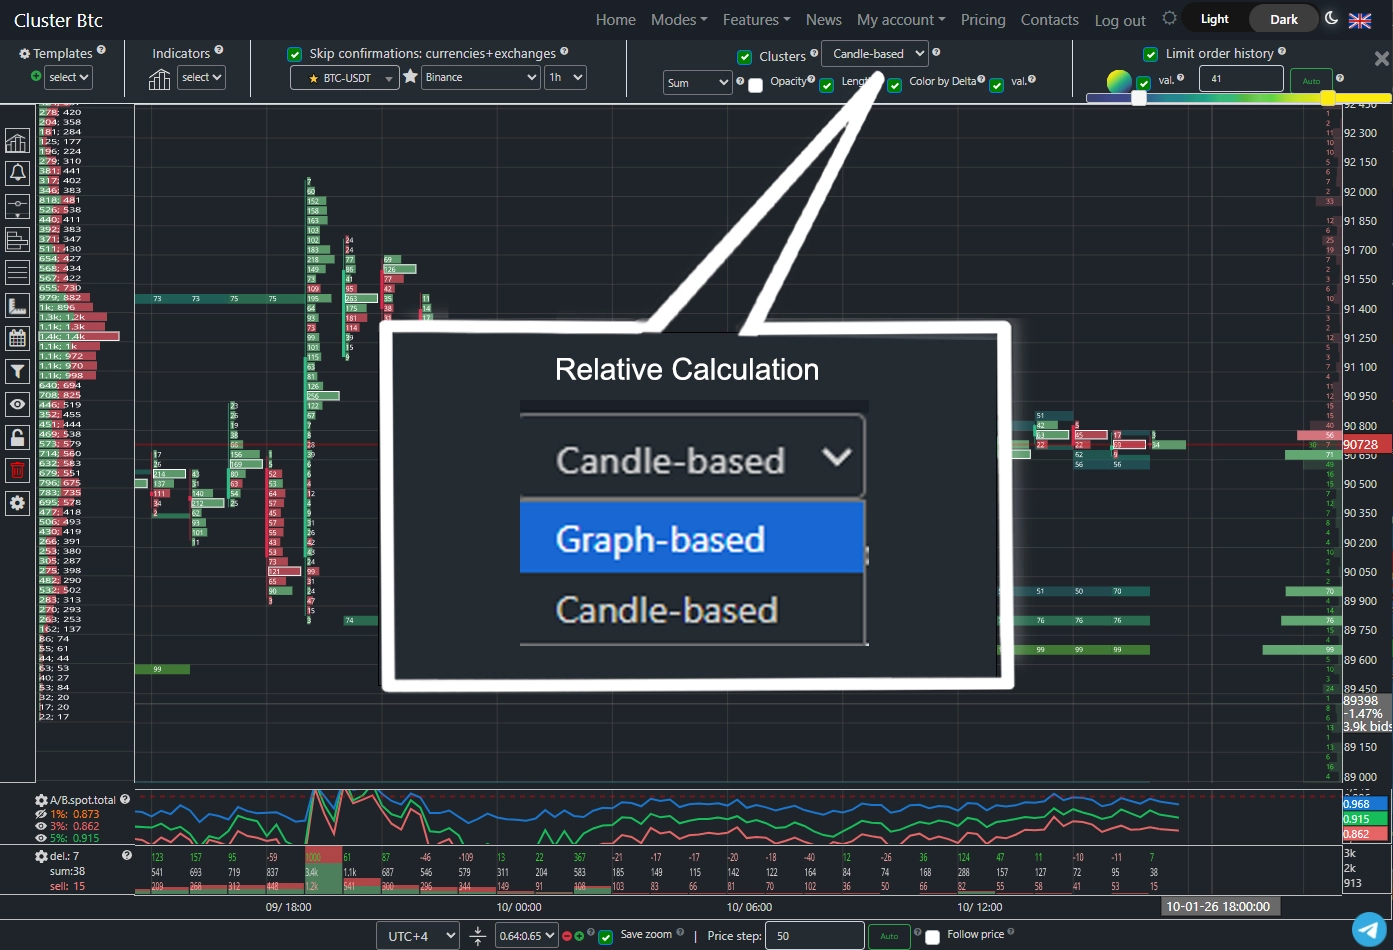
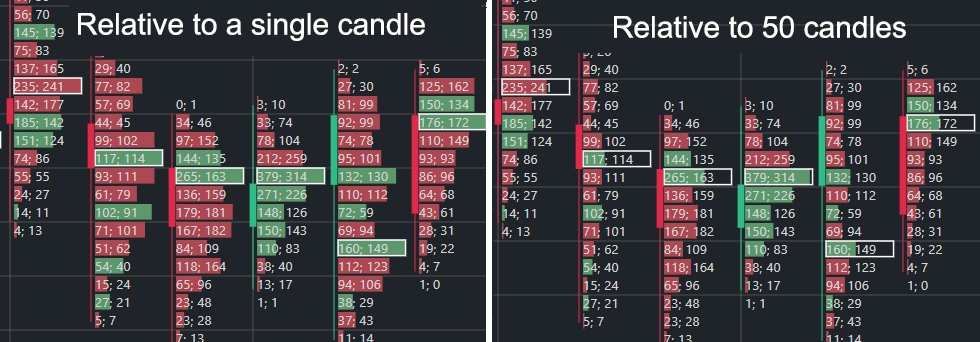
Relative Calculation.
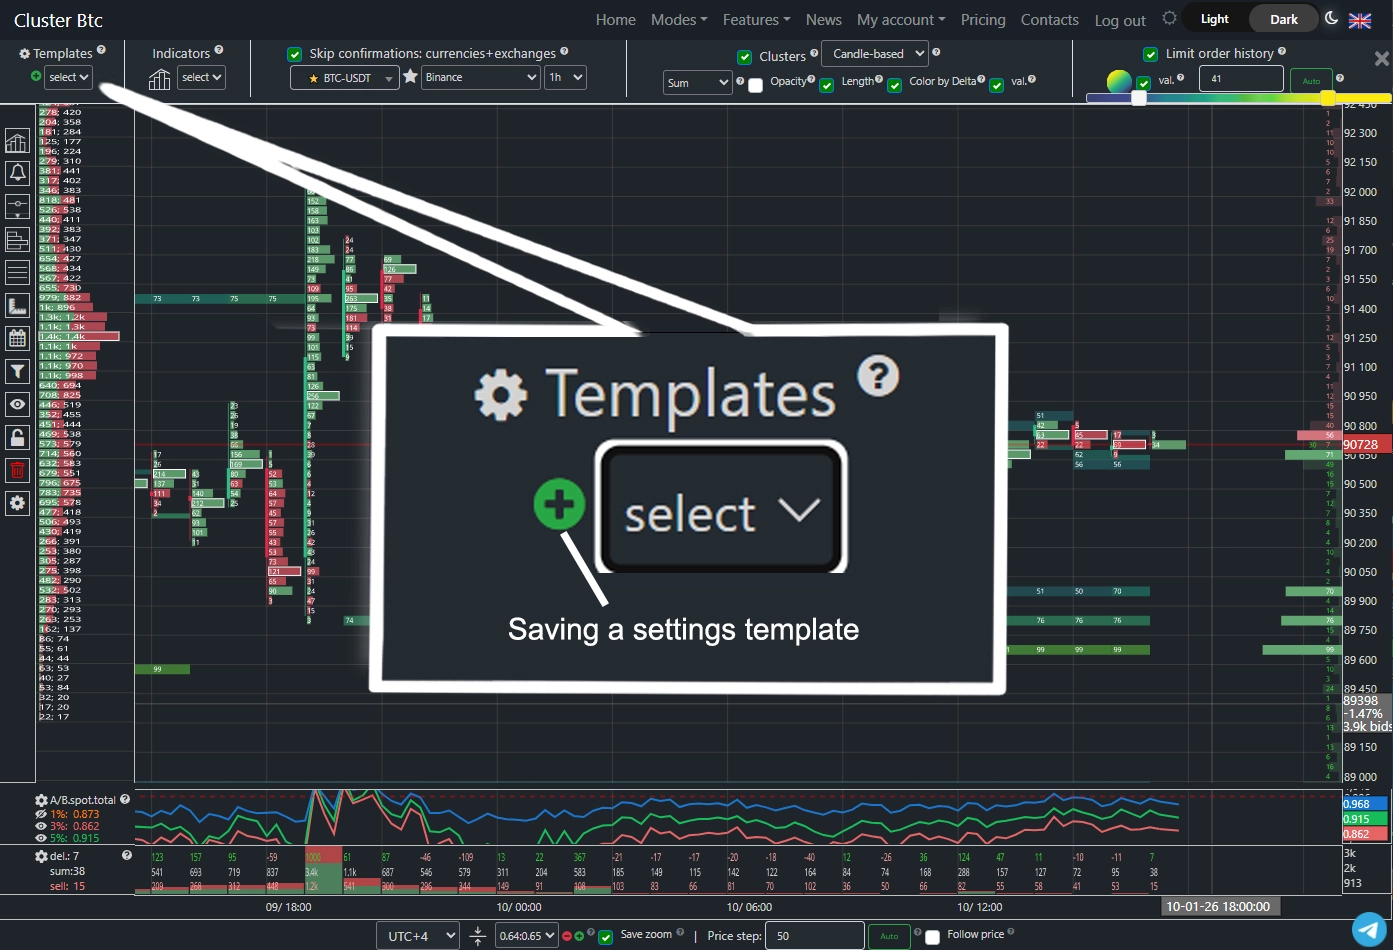
Settings Templates.
After selecting an exchange, timeframe, and appearance settings, you can save them as a template. Templates allow quick switching between pre-configured setups.
Candle & Cluster Context Menu
Right-clicking a cluster opens a menu with the following options:
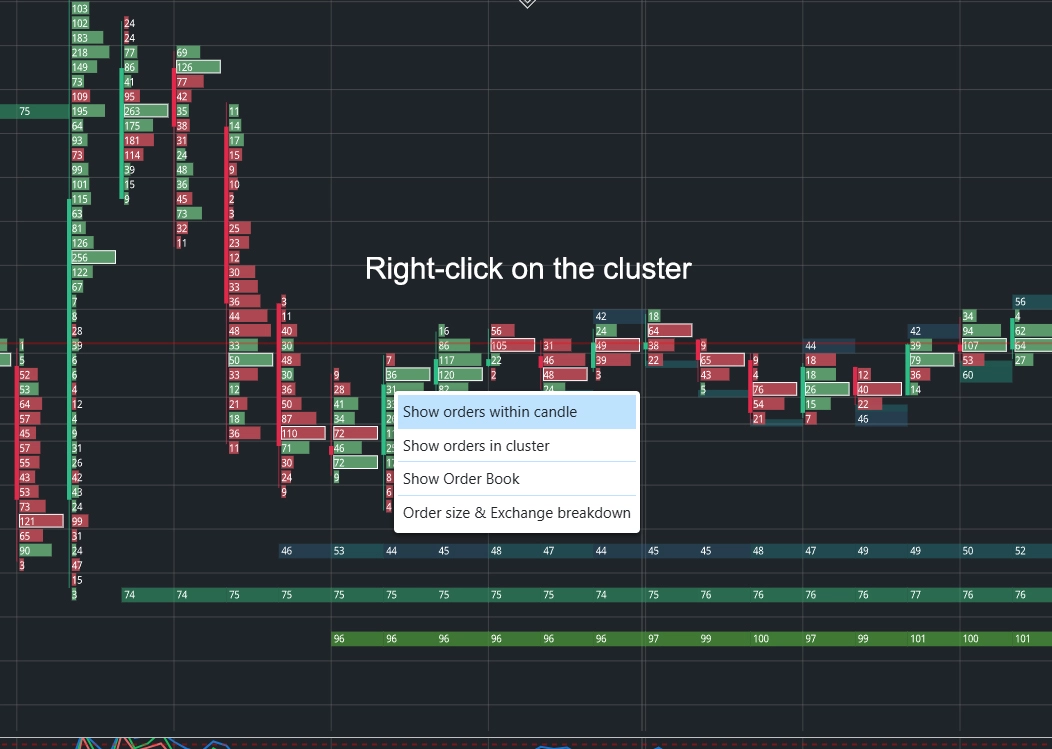
Show orders in candle or cluster.
Displays all large orders executed during this candle or within this specific cluster.
More about the “Orders” tab.
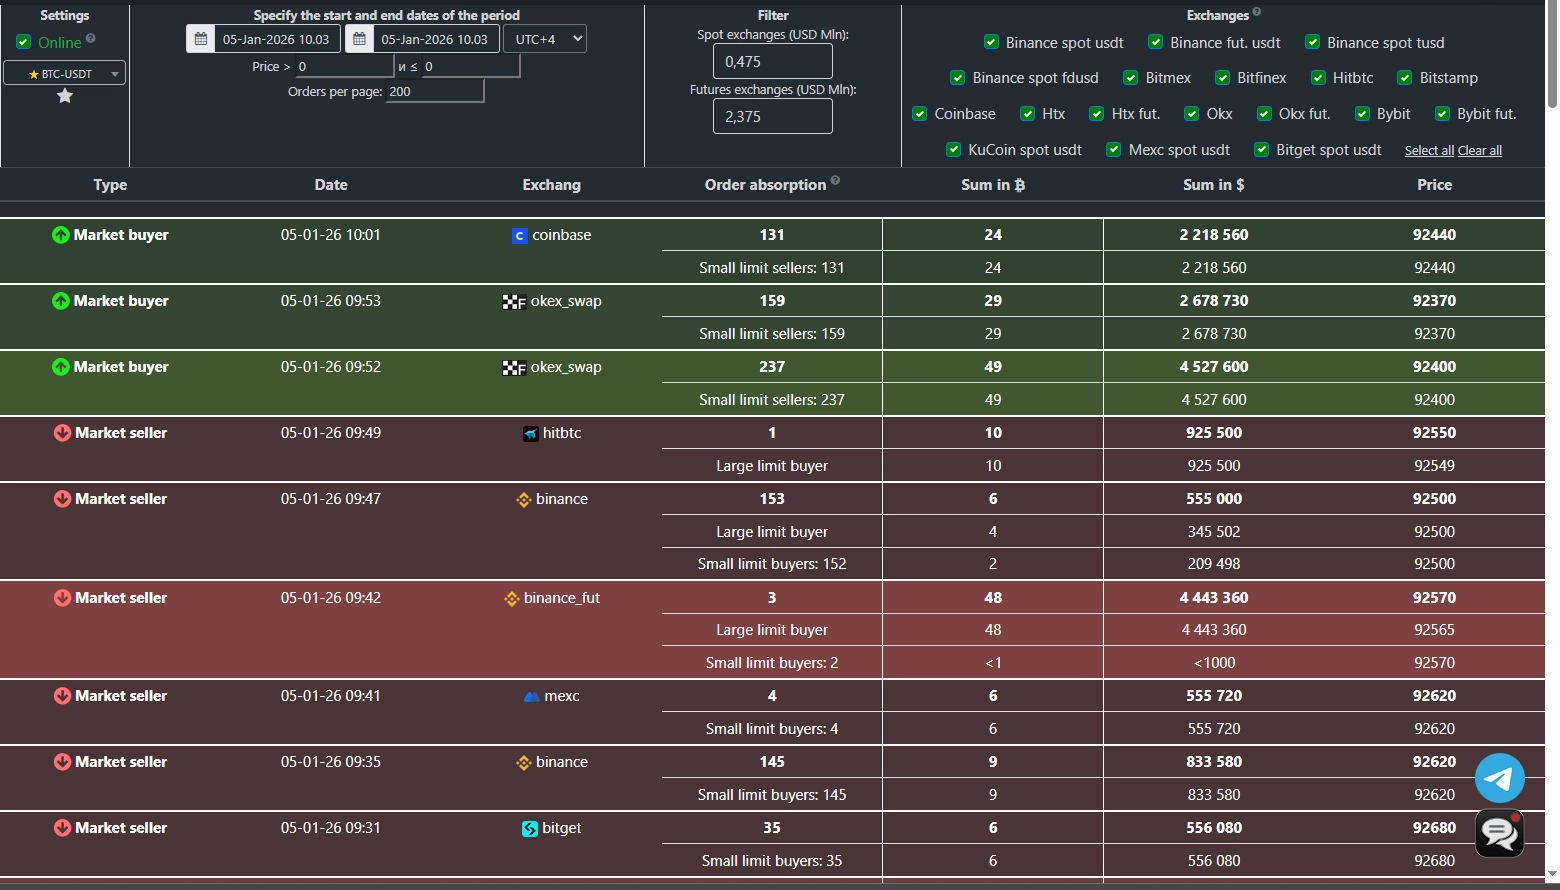
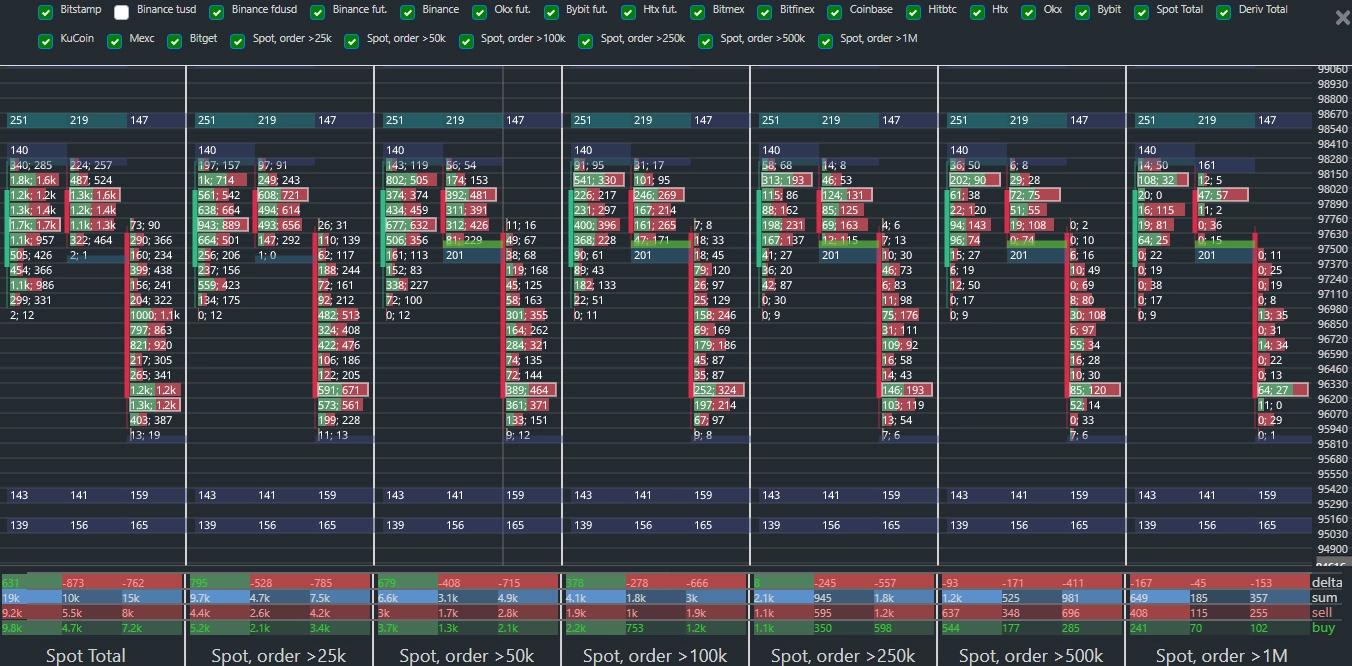
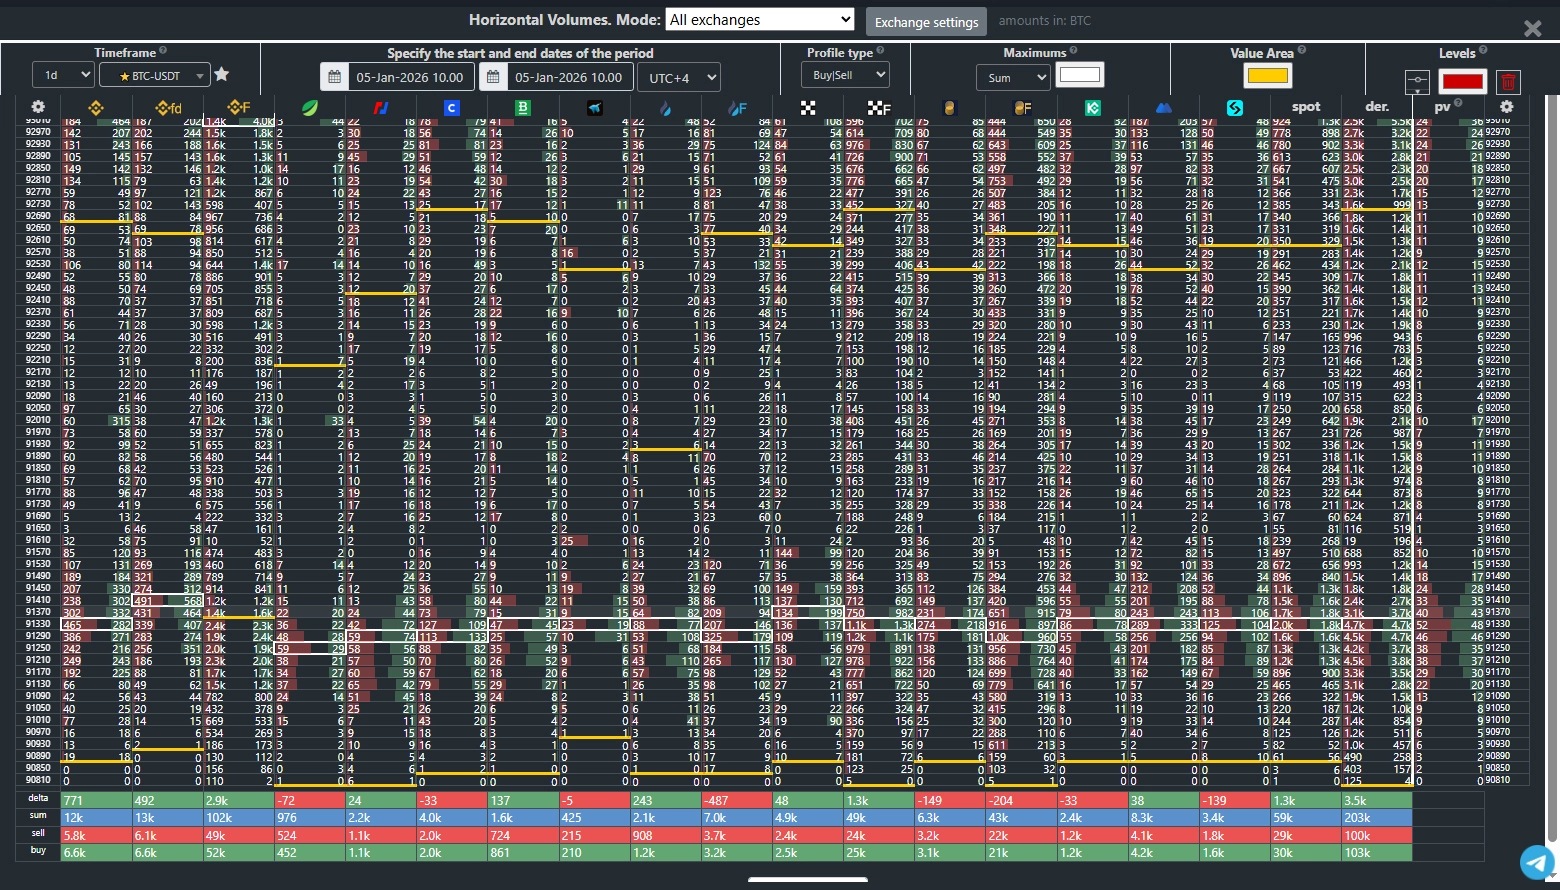
Breakdown by order size and exchanges
Opens this and adjacent candles across all available exchanges. The new window lets you examine clusters, volumes, and delta in detail across all whale order-size groups and exchanges.
Adding Limit Orders from Order Book to Chart
Cluster Btc allows you to overlay historical movements of large limit order walls onto the chart.
This provides powerful analytical capabilities for identifying whale behavior.
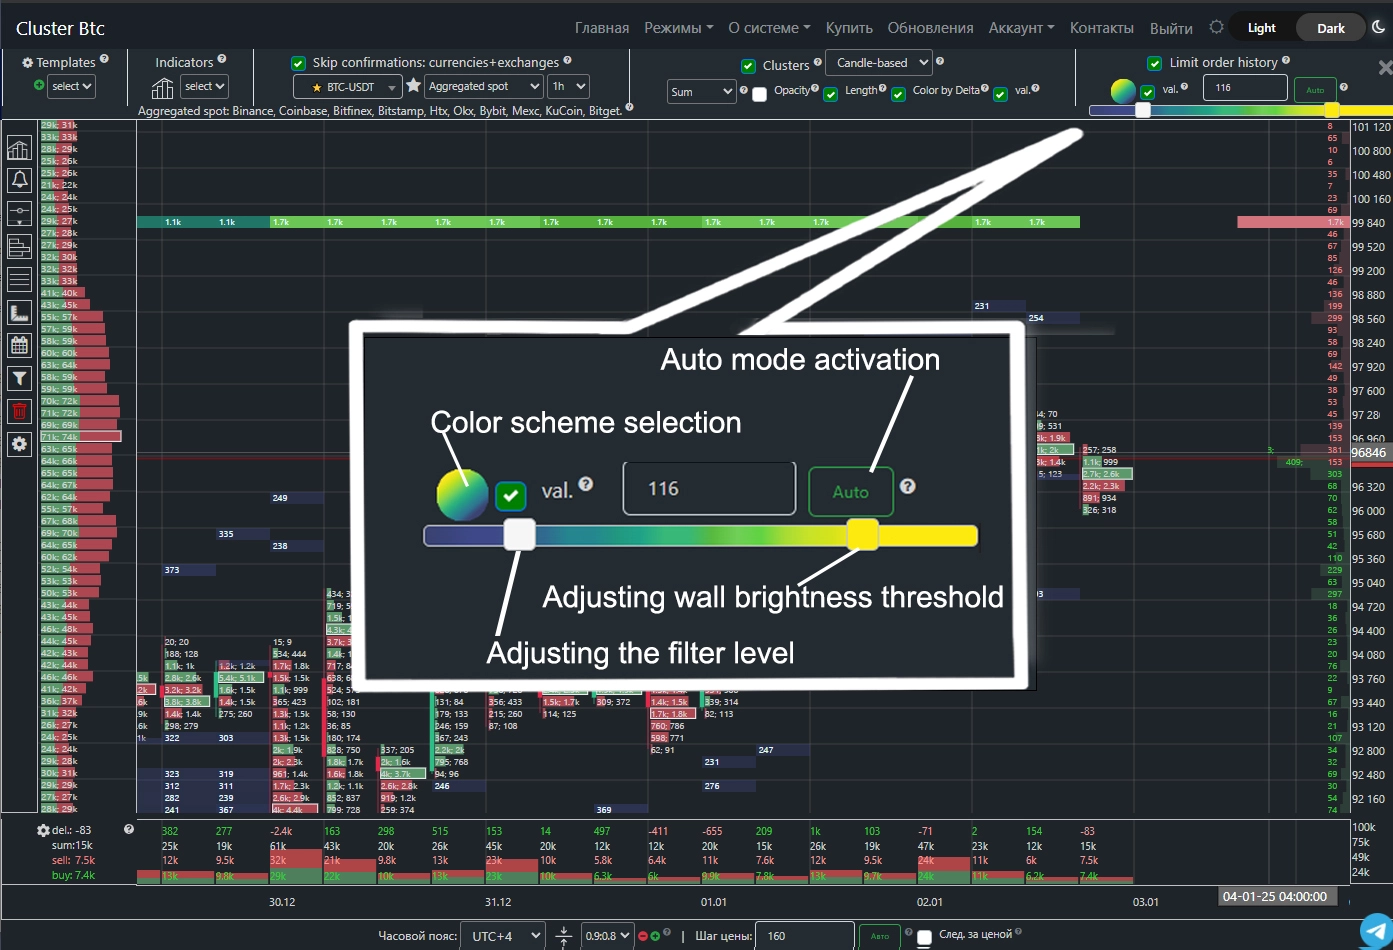 The system automatically selects a filter coefficient to exclude small orders and display only significant limit walls.
You can manually adjust the filter using the left slider to quickly find your preferred wall visibility level.
The right slider controls the brightness threshold: moving it left lowers the threshold (more walls appear bright); moving it right makes only the largest orders brightly colored.
The system automatically selects a filter coefficient to exclude small orders and display only significant limit walls.
You can manually adjust the filter using the left slider to quickly find your preferred wall visibility level.
The right slider controls the brightness threshold: moving it left lowers the threshold (more walls appear bright); moving it right makes only the largest orders brightly colored.
Clicking “Auto” automatically sets the wall size based on current market conditions.
Show – enables historical wall movement on the chart.
Values – displays the BTC amount of orders in each wall.
Volume Profile
This tool lets you select a chart area to display total traded volume at each price level.
It’s a powerful instrument with significant analytical potential.
Horizontal volumes reveal market interest at specific price levels, helping identify strong zones
(where price finds support or resistance)
and weak zones (which price moves through with little reaction).
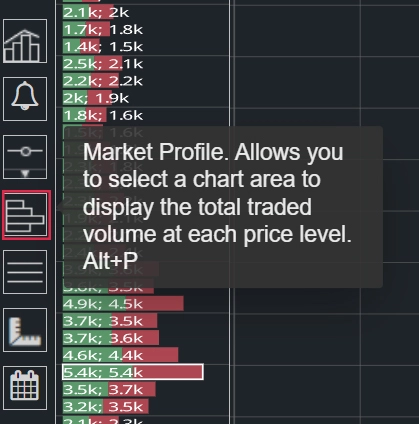
Click the profile icon in the “Tools” panel.
After configuring settings, click once on the chart to set the profile start,
drag the mouse to the end point, and click again to apply the profile.
If the settings panel obstructs your view, click “Hide Settings.”
Profile Type.
Sum – shows total buy + sell volume.
Buy | Sell – splits the bar: green for buys, red for sells.
Delta – shows the difference between buys and sells; bar color changes based on buyer or seller dominance.
Buy | Sell – splits the bar: green for buys, red for sells.
Delta – shows the difference between buys and sells; bar color changes based on buyer or seller dominance.
Maximum.
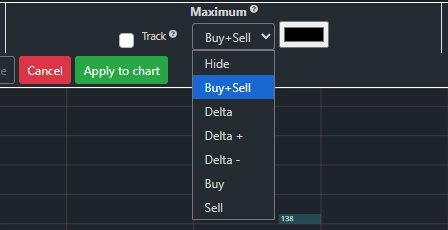
A maximum level can be added to charts and monitored across other tabs.
The system offers several maximum types:
Buy+Sell – price level with highest total traded volume.Delta – level with greatest buy/sell difference.
Delta+ – level with strongest buyer dominance.
Delta− – level with strongest seller dominance.
Buy – highest buy volume.
Sell – highest sell volume.
Track – highlights the level with your chosen color in the
“Order Book” and
“Volumes”
tabs for easy monitoring, and extends the line to the chart’s end.
You can customize line color, opacity, and add a comment.
Value Area.
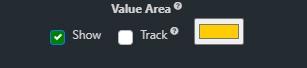
Indicates the price range within which 70% of all trades occurred.
Track – highlights the zone with your chosen color in the “Order Book” and “Volumes” tabs, extends the lines to the chart’s end, and allows custom color, opacity, and comments.
Track – highlights the zone with your chosen color in the “Order Book” and “Volumes” tabs, extends the lines to the chart’s end, and allows custom color, opacity, and comments.
Smart Multi-Exchange Volume Aggregation.
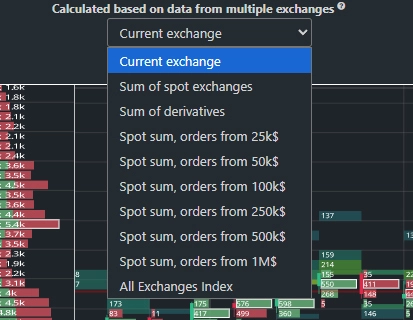
Spot Exchanges Sum – profile built from aggregated spot exchange volumes: Binance (USDT, USDC, FDUSD, BUSD), Coinbase, Bitfinex, Bitstamp, HTX, OKX, Bybit, MEXC, KuCoin, Bitget.
Spot Sum, Orders Above Threshold – profile built from aggregated spot volumes, including only market orders exceeding your specified filter threshold.
All-Exchange Index – uses a proprietary algorithm to weight each exchange by its trading significance and computes a unified volume profile across all spot and futures markets.
Volume aggregation produces smoother results:
insignificant levels active on only one exchange are filtered out,
while levels confirmed across multiple exchanges become more prominent.
Control Panel.
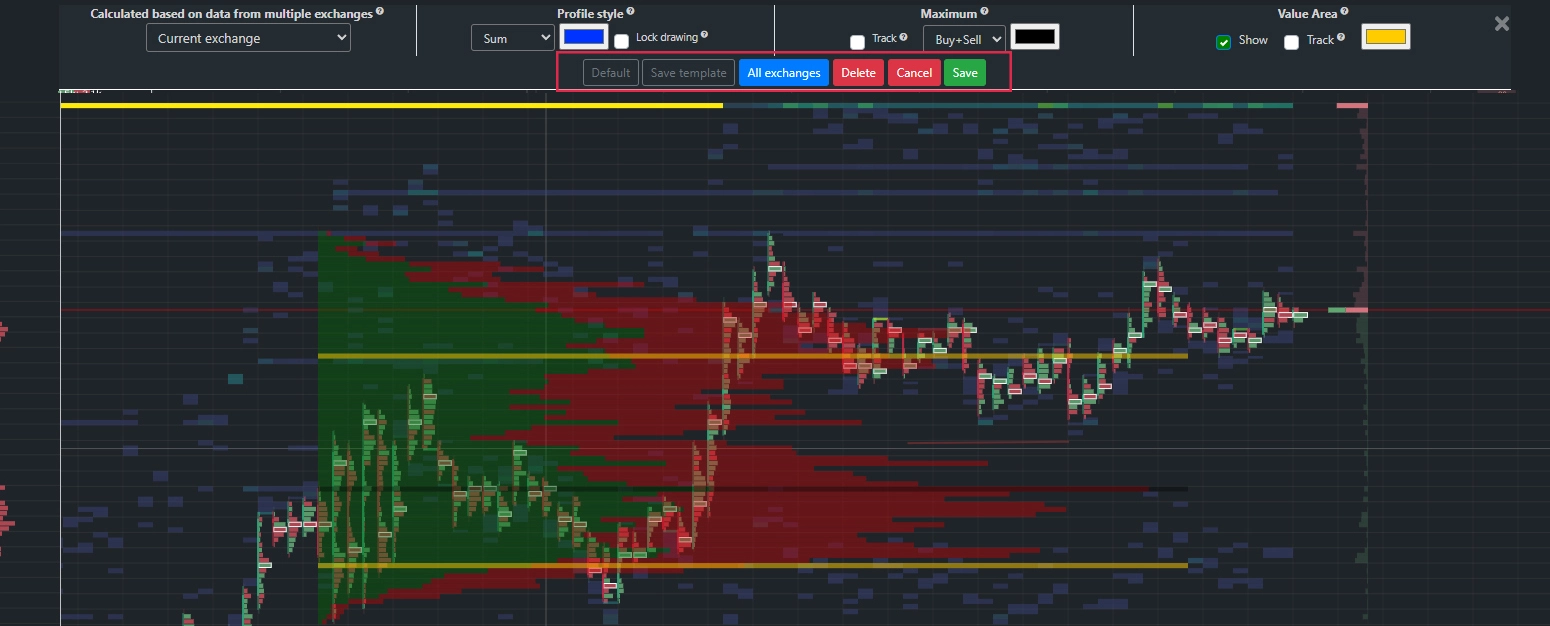 Default – resets settings to standard values.
Save Template – saves current parameters for future use.
Hide Settings – hides the settings panel.
All Exchanges – opens a dedicated “Volumes” tab showing this profile across all available exchanges, enabling detailed cross-exchange comparison.
Telegram Alerts
Telegram bot alerts are available for each indicator. Click the bell icon (visible on mouse hover over an indicator) to create an alert.
On first use, link your account to the Telegram bot: follow the provided link and send the numeric code shown on the alert creation page to the bot.
Available alert triggers include:
Cluster volume (buys, sells, delta).
Candle volume.
Price change percentage per candle.
Price level breach.
Placement of a limit order exceeding a threshold.
Execution of large market orders.
BID/ASK sums at specified depths, and their ratio.
Telegram alerts deliver instant notifications about critical market events, enabling rapid response—even when you’re away from your computer.
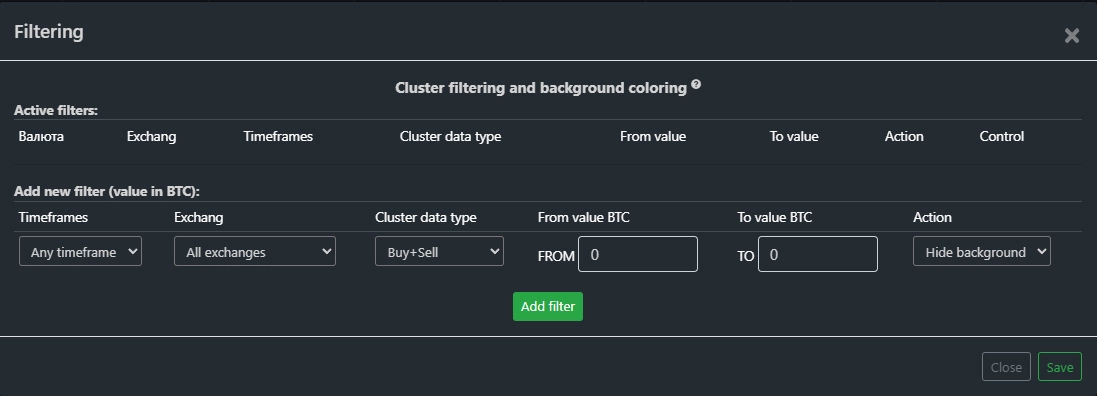
Cluster Filtering and Background Highlighting
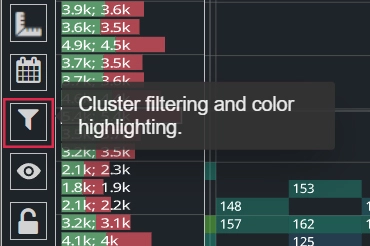
You can define volume, delta, buy, or sell ranges to filter or highlight clusters with a custom background color.
Click the corresponding icon in the toolbar to add new filters.
You can specify a timeframe for the rule or select “Any Timeframe.”
Available cluster data types for filtering:
Buy + Sell – total traded volume.
Delta (Any) – buys minus sells, regardless of sign.
Delta (Positive) – only clusters with buyer dominance.
Delta (Negative) – only seller-dominant clusters.
Buy – total buy volume in cluster.
Sell – total sell volume.
In the “From” field, enter the start of your range in the base currency (e.g., BTC for BTC-USDT pairs).
The “To” field defines the range end.
In the “Action” field, choose either to hide clusters in this range or highlight them with a specific color.
After configuring parameters, click “Add Filter.”
You can combine multiple rules—for example, hide small volumes and simultaneously highlight the largest clusters.
“Vertical Volume” Indicator
Displays buy volume, sell volume, total sum, and delta.
“Vertical Delta” Indicator
Calculates the difference between market buy and sell orders. Delta helps identify whether buyers or sellers dominate within a specific candle.
“Cumulative Delta” Indicator
Calculates the running total of market buy minus sell orders from your selected start point.
It reveals trends in buyer or seller dominance. You can choose from three bar styles:
Buys and sells aligned at the same level.
Buys above, sells below.
Chart-style, where each new bar starts at the previous bar’s close level.
You can also set a reset period for the cumulative delta to align analysis with your trading strategy.
“BID/ASK Sums” Indicator
Shows aggregated dollar values of limit orders at 1%, 3%, 5%, 8%, 20%, and 60% depths.
We aggregate order book data across supported exchanges, letting you evaluate overall limit-order supply/demand balance across the entire market on a single indicator.
Four aggregation modes are available:
Spot Exchanges – Crypto vs. Stablecoins.
Displays total Bids and Asks across all spot exchanges for a given crypto vs. stablecoin pairs.
Displays total Bids and Asks across all spot exchanges for a given crypto vs. stablecoin pairs.
Spot Exchanges – BTC + Altcoins vs. Stablecoins.
Aggregates limit orders across all available spot pairs in the system.
Aggregates limit orders across all available spot pairs in the system.
Two analogous modes are available for derivatives markets:
– Specific token derivatives vs. stables
– All Bitcoin and altcoin derivatives available on the platform.
– Specific token derivatives vs. stables
– All Bitcoin and altcoin derivatives available on the platform.
You can choose indicator granularity:
Min – uses the same timeframe as the chart (one indicator value per candle).
Max – uses a finer timeframe than the chart, showing intra-candle dynamics.
Results are displayed as a chart with values in millions of USD.
“ASK/BID Ratio” Indicator
Shows the ratio of total ASK to total BID dollar values at various order book depths (ASK $ / BID $). A ratio of 1 indicates balance; >1 indicates seller dominance; <1 indicates buyer dominance.
Uses the same aggregation system as the previous indicator.
To add this indicator, open the indicator management panel.
Click the desired indicator panel, configure parameters, and click “Add Indicator.”
You can add multiple instances with different settings.
Toggle line visibility directly on the chart by clicking the eye icon next to each parameter.
Indicator granularity options:
Min – same timeframe as chart (one value per candle).
Max – finer timeframe, showing intra-candle dynamics.
Toggle full indicator information
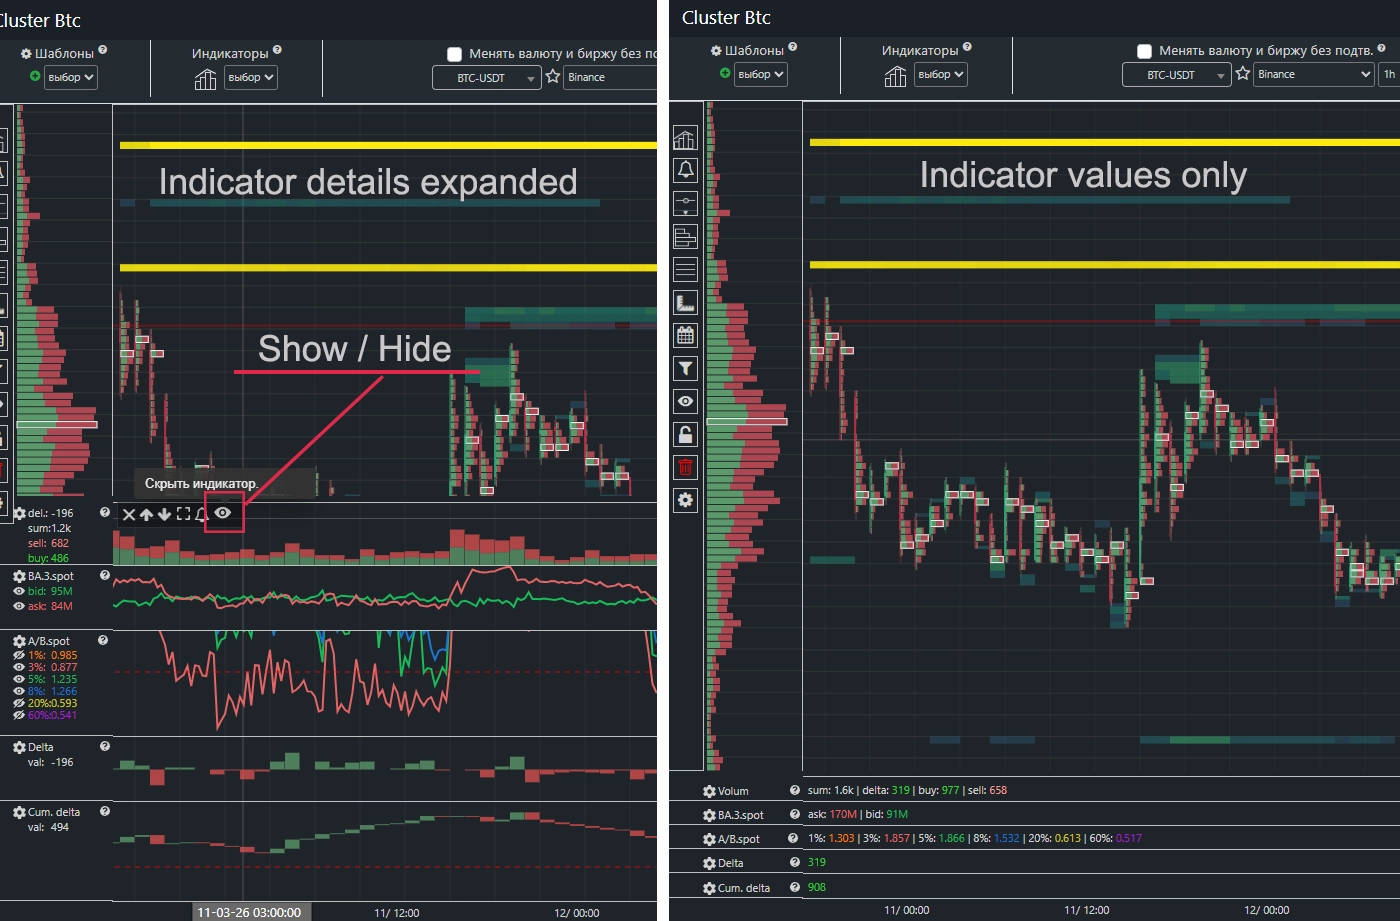
Collapse indicator charts to a compact values-only panel, freeing up space to display more indicators simultaneously. Expand any indicator to your preferred width and toggle between detailed and compact views on demand.
Click the eye icon 👁️ in the indicator panel to show or hide an indicator's chart.
Drawing Tools
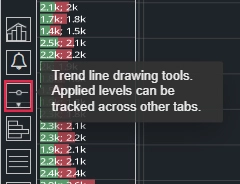
Trend line drawing tools let you mark levels on the chart and optionally track them across other system tabs.
Track – highlights the level with your chosen color in the
“Order Book” and
“Volumes”
tabs, and extends the line to the chart’s end.
You can set color, opacity, and add a comment.
All Exchanges – applies the drawn level to charts of all available exchanges.
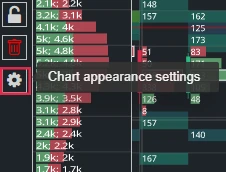
Chart Color Scheme Settings
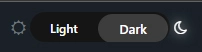
Switch between light and dark site themes using the icons in the top-right corner.
Customize candle, cluster, background, and other chart element colors in the color scheme settings menu.