Bitcoin (BTC), Ethereum (ETH), and other cryptocurrencies — "Spot Total" chart.
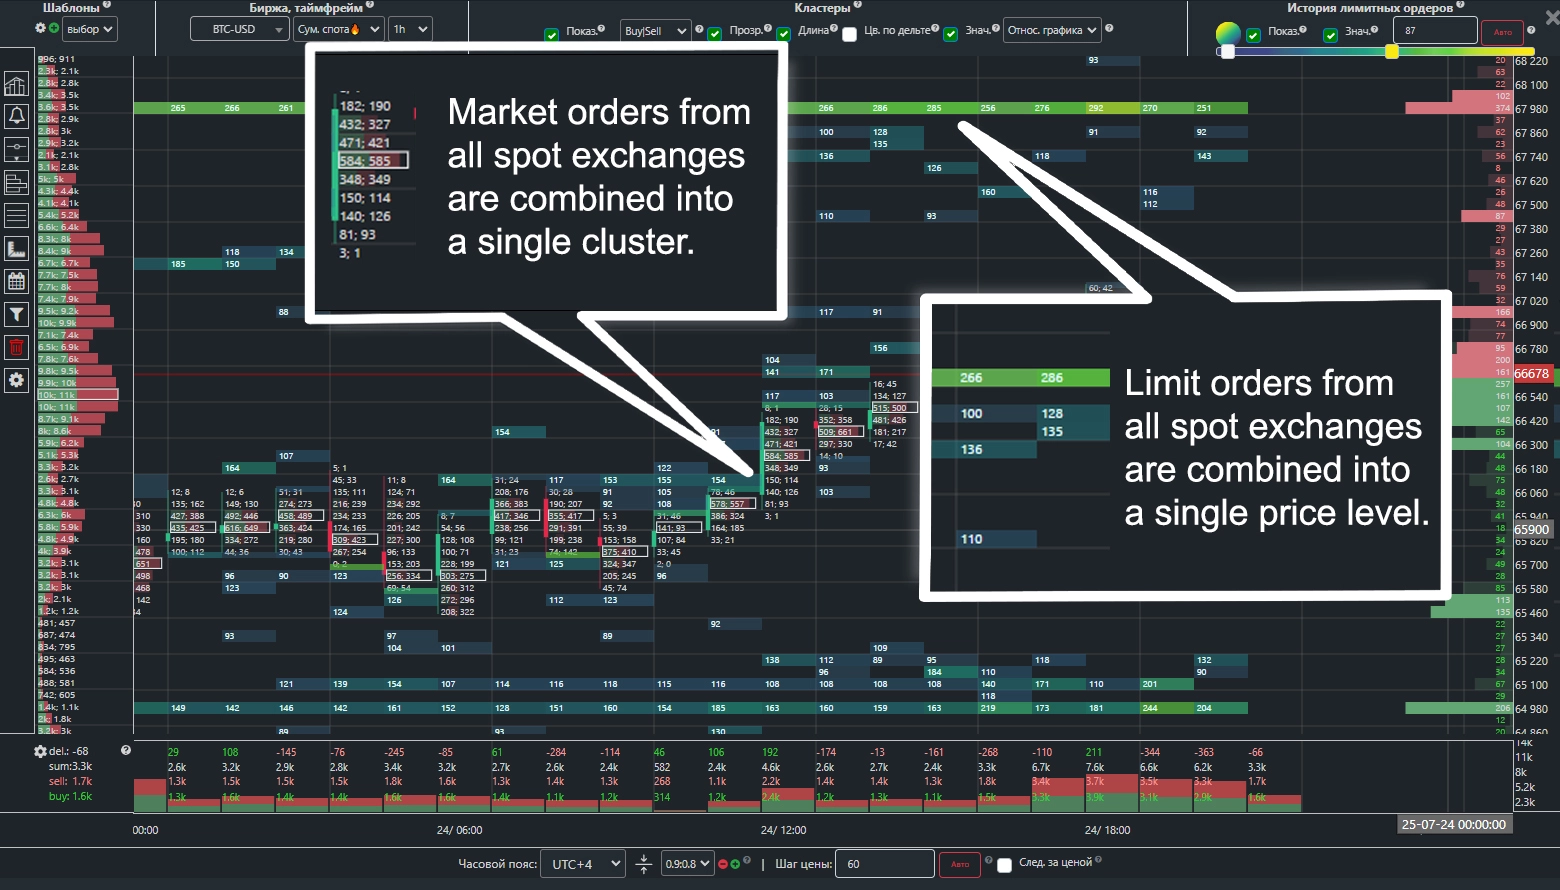
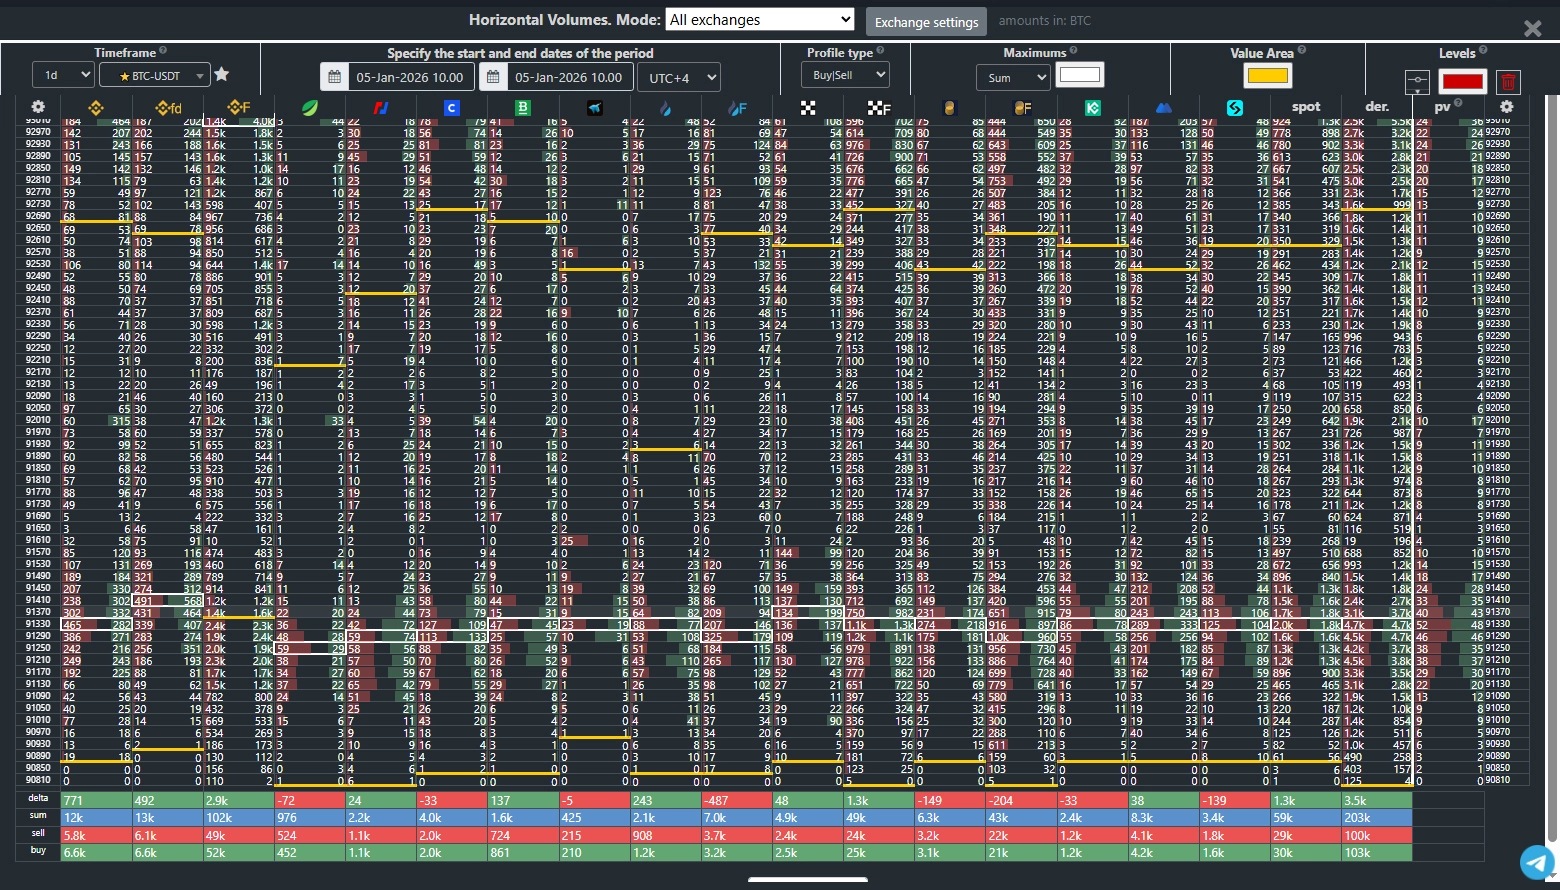
The «Spot Sum» chart for Bitcoin on ClusterBtc.com provides a comprehensive view of the market by displaying market buy and sell volumes at each price level within a candle across all major spot cryptocurrency exchanges—all on a single screen. This creates a consolidated cluster chart that captures the maximum number of large players, who are typically scattered across numerous platforms.
The chart aggregates volume data from the following exchanges: Binance (pairs to USDT, BUSD, FDUSD, TUSD), Coinbase, Bitfinex, Bitstamp, Htx, Okx, Bybit, KuCoin, Mexc, Bitget.
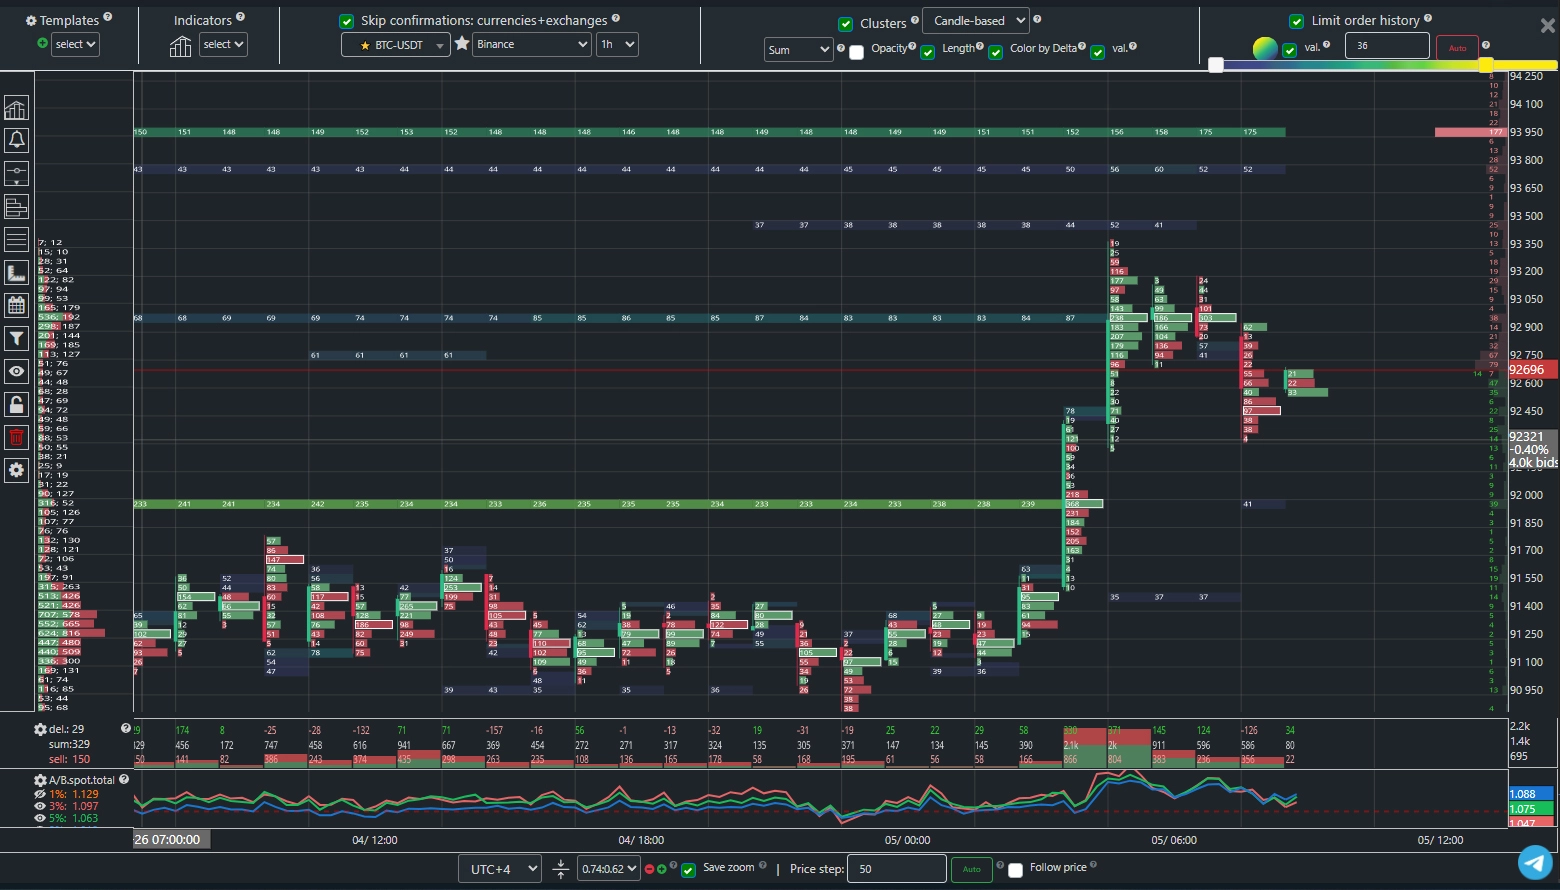
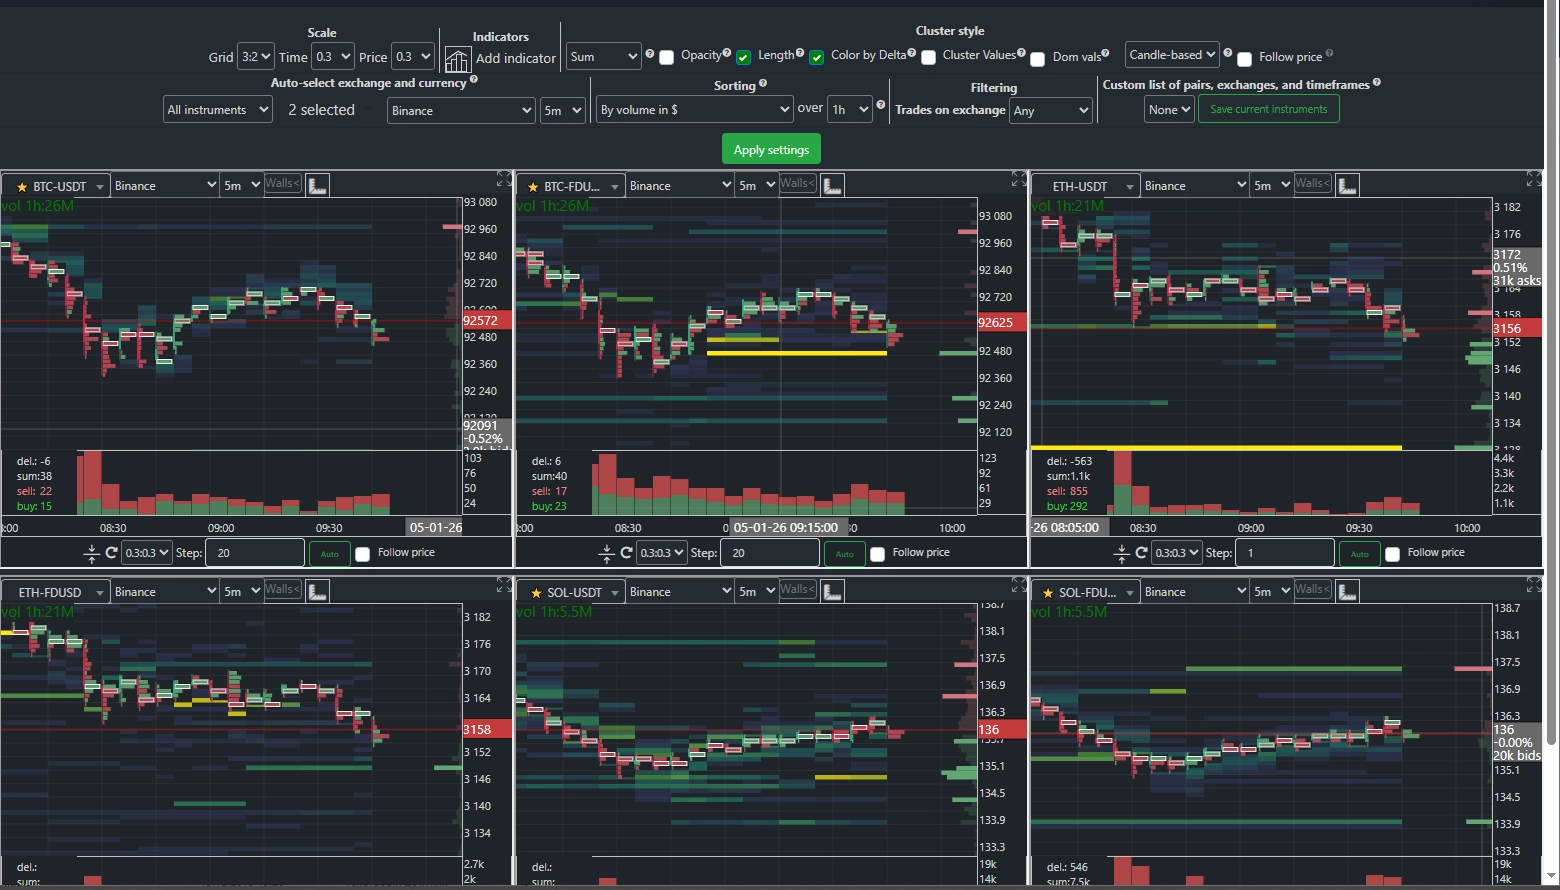
You gain access to a wide range of analytical tools, including indicators such as «Delta» (showing buyer vs. seller dominance) and the cumulative «Cumulative Delta» for the entire cryptocurrency market. The consolidated volume profile helps identify key support and resistance levels, as well as «empty zones» where price moves with little to no trader interest. You can also track historical movements of large limit order blocks directly on the chart, along with the real-time spot market order book.
To activate the «Spot Sum» cluster chart mode, switch to «Clusters» mode and select «Spot Sum» in the exchange selection window.
Want to learn more?
Key features in 1.5 minutes
Explore the key points.
Complete guide in 18 minutes
Get comprehensive information.
Discover all analysis modes
Cluster chart
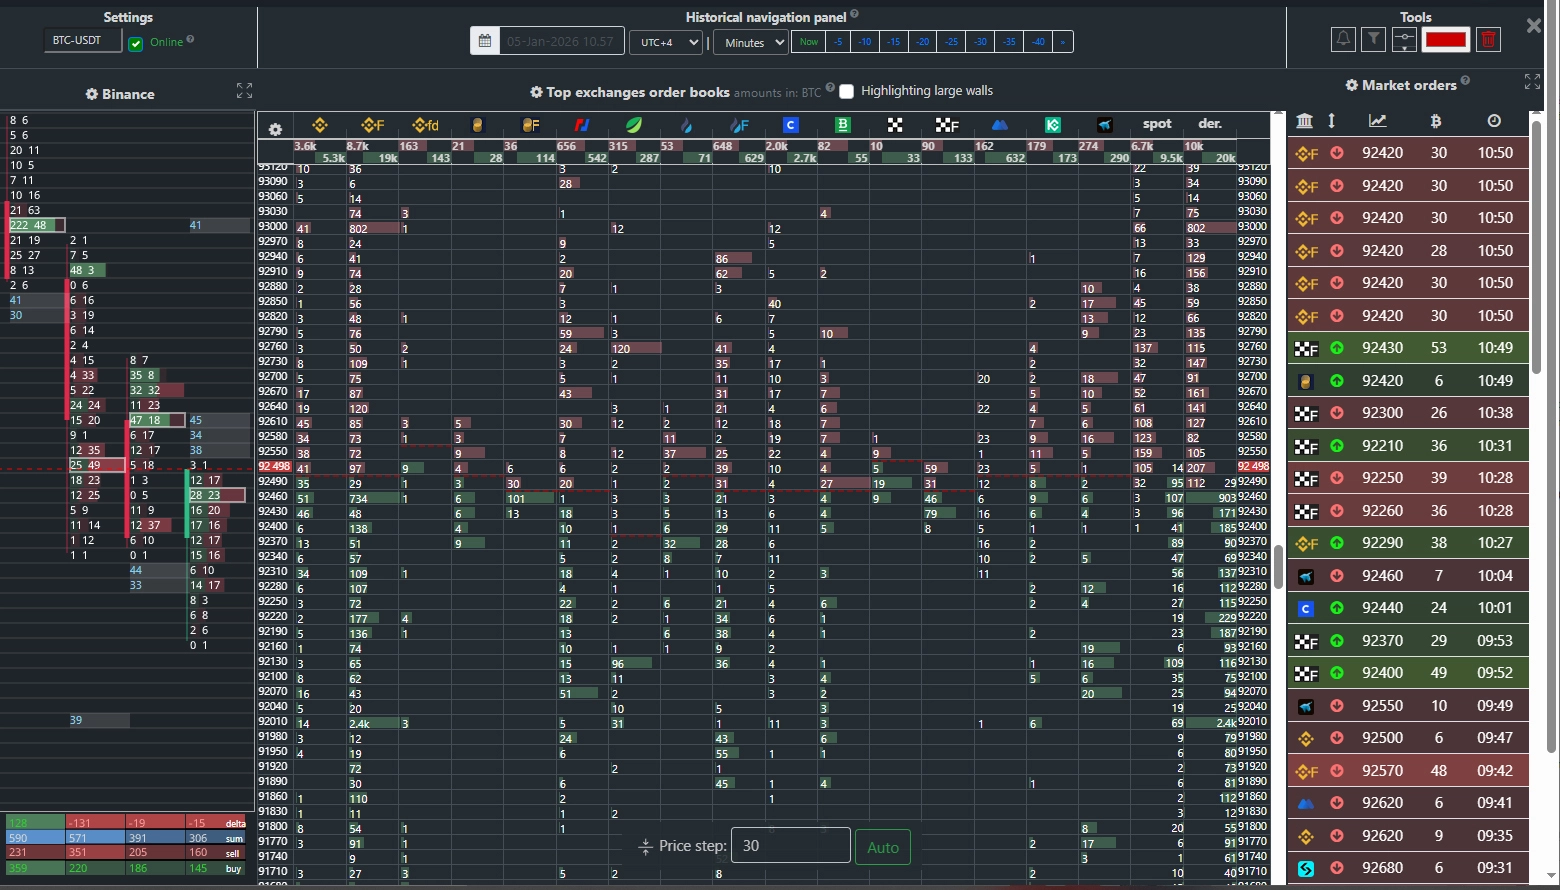
Bitcoin order books
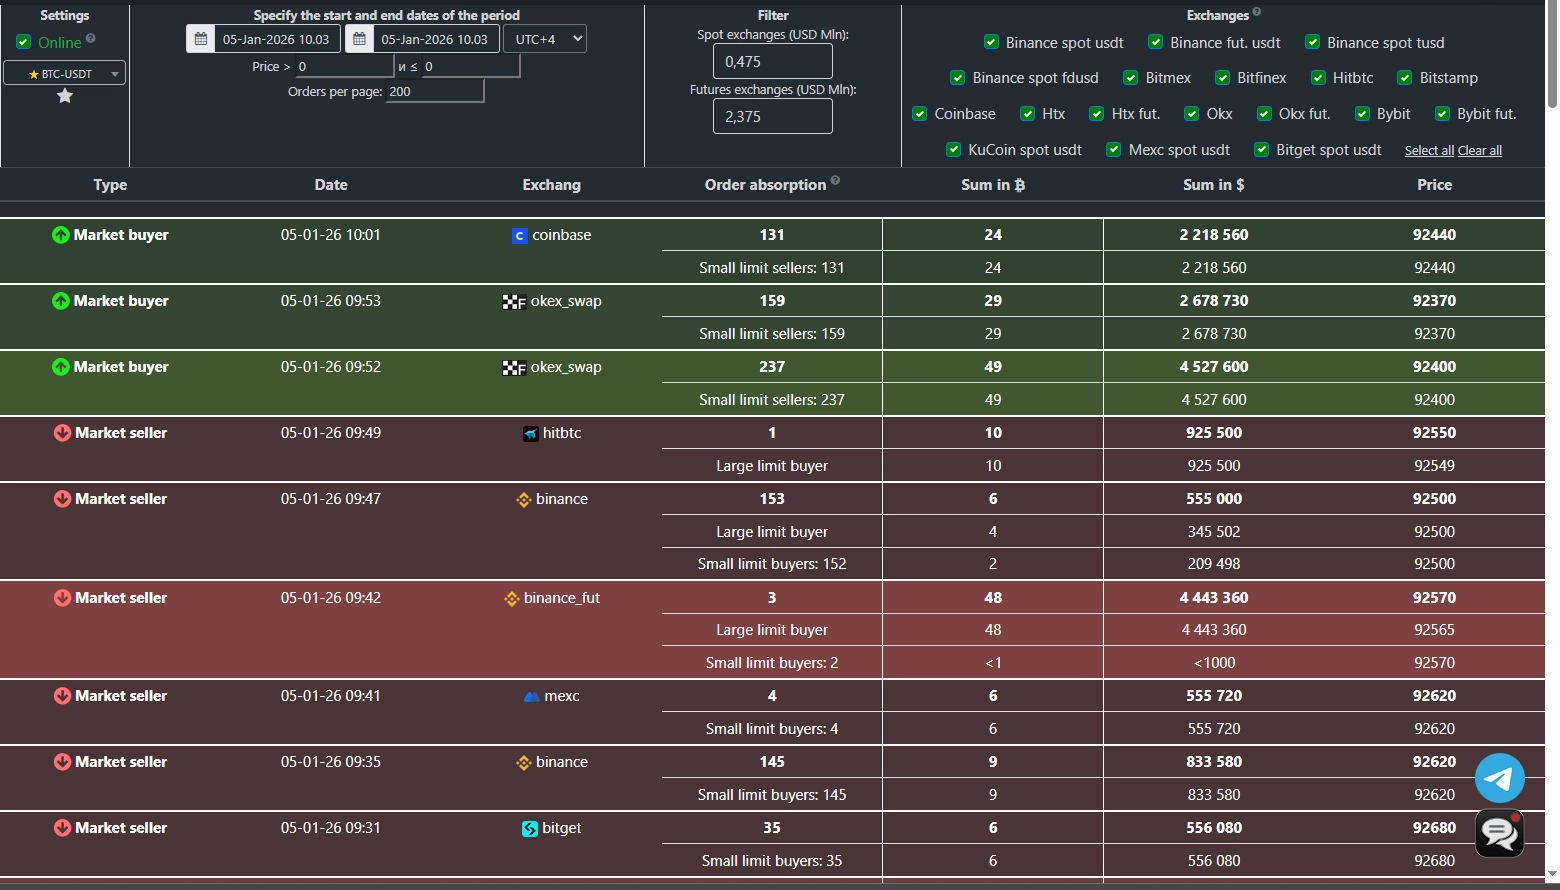
Market orders
Volum
Cryptocurrency screener
7 days
1 Month
12.78
- Basic plan
- Save 0 $
- All features available.
3 Months -17%
38.34
31.81
- Only 10.6 $ / month
- Save 6.52 $
- All features available.
1 Year -34%
153.36
101.19
- Only 8.43 $ / month
- Save 52.13 $
- All features available.